Bitcoin latest bull market experienced several 30% plunges, will history repeat itself?
- Bitcoin growth has been accompanied by sharp corrections.
- Technical indicators imply that BTC will go down before another bullish wave.
- On-chain data shows that there is a strong barrier on the approach to $18,000.

Massive 30-40% corrections are nothing new to the cryptocurrency market. Bitcoin steady ascent from zero to nearly $20,000 was accompanied by large price swings as head-spinning growth is always followed by a heart-breaking collapse that eventually leads to another bullish wave and a new all-time high.
Bitcoin is prone to sharp corrections
The retrospective analysis of Bitcoin price movements proves its cyclical nature is within the global bullish trend.
As the chart below shows, BTC experienced at least nine large drawdowns during its bull's run of 2015-2017. It took the pioneering asset nearly three years to make its way from $152 on January 14, 2015, to $19,666 on December 17, 2017. However, the path was not a straight line but rather a Waltz pattern with one step back and two steps forward with the average correction from peal to bottom of 37%.
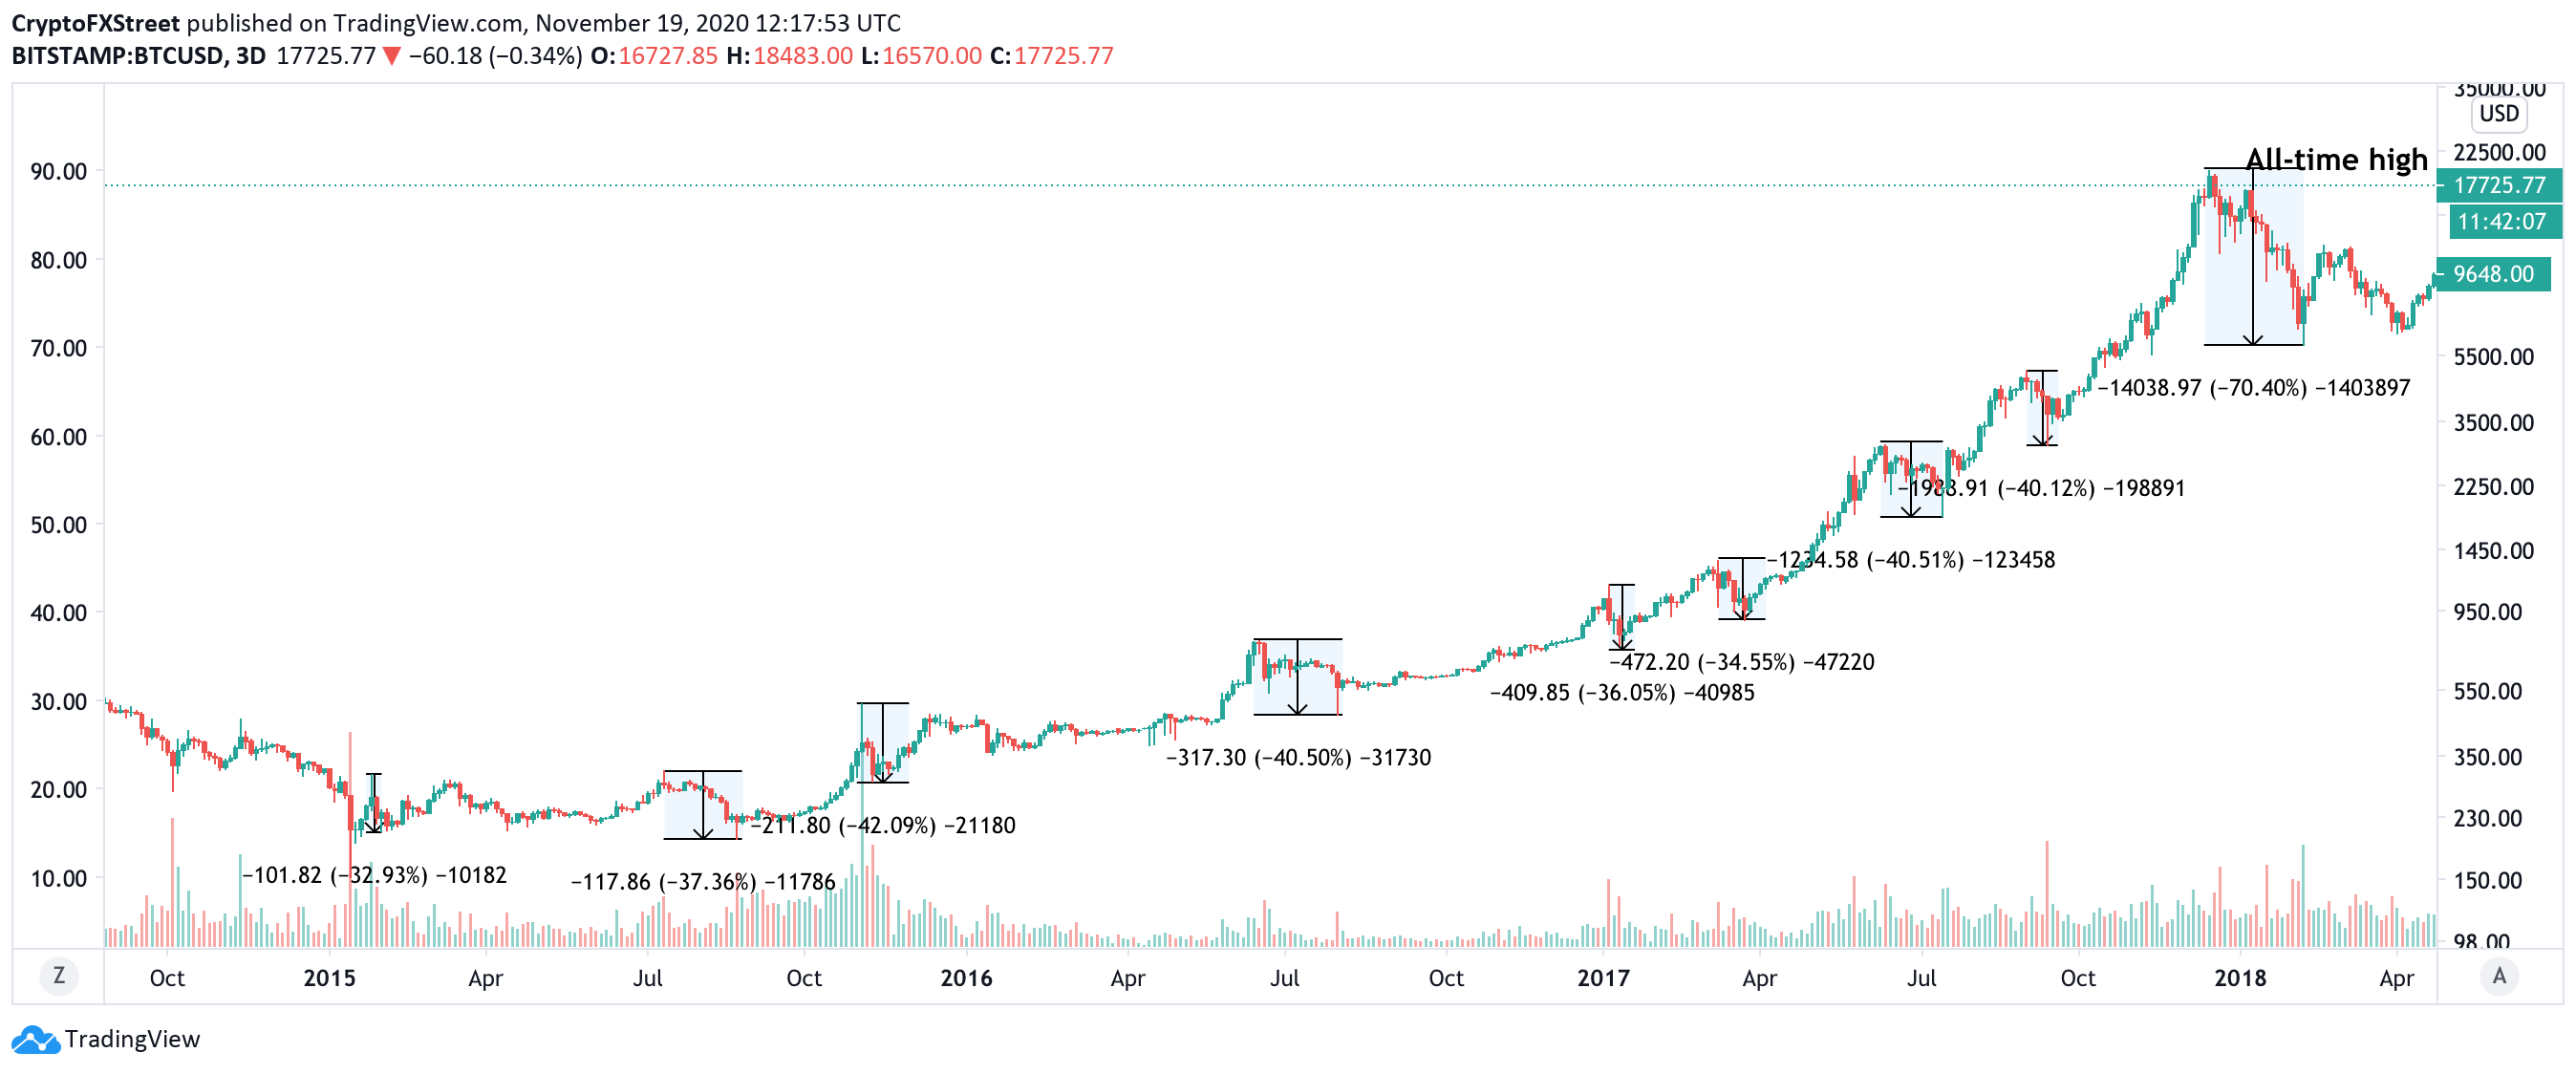
Bitcoin bullish trend of 2015-2017
As FXstreet previously pointed out, in 2013, Bitcoin managed to clear an all-time high of nearly $1,200 only after two unsuccessful attempts that were accompanied by 30-40% corrections.
In the bull's trend of 2020, BTC bottomed at $3,850 on March 13 and has been gaining ground rapidly ever since. Looking at the chart below, it can be seen that the market experienced at least two 20% corrections on the way up, which means that the upside is relatively fast by historical standards.
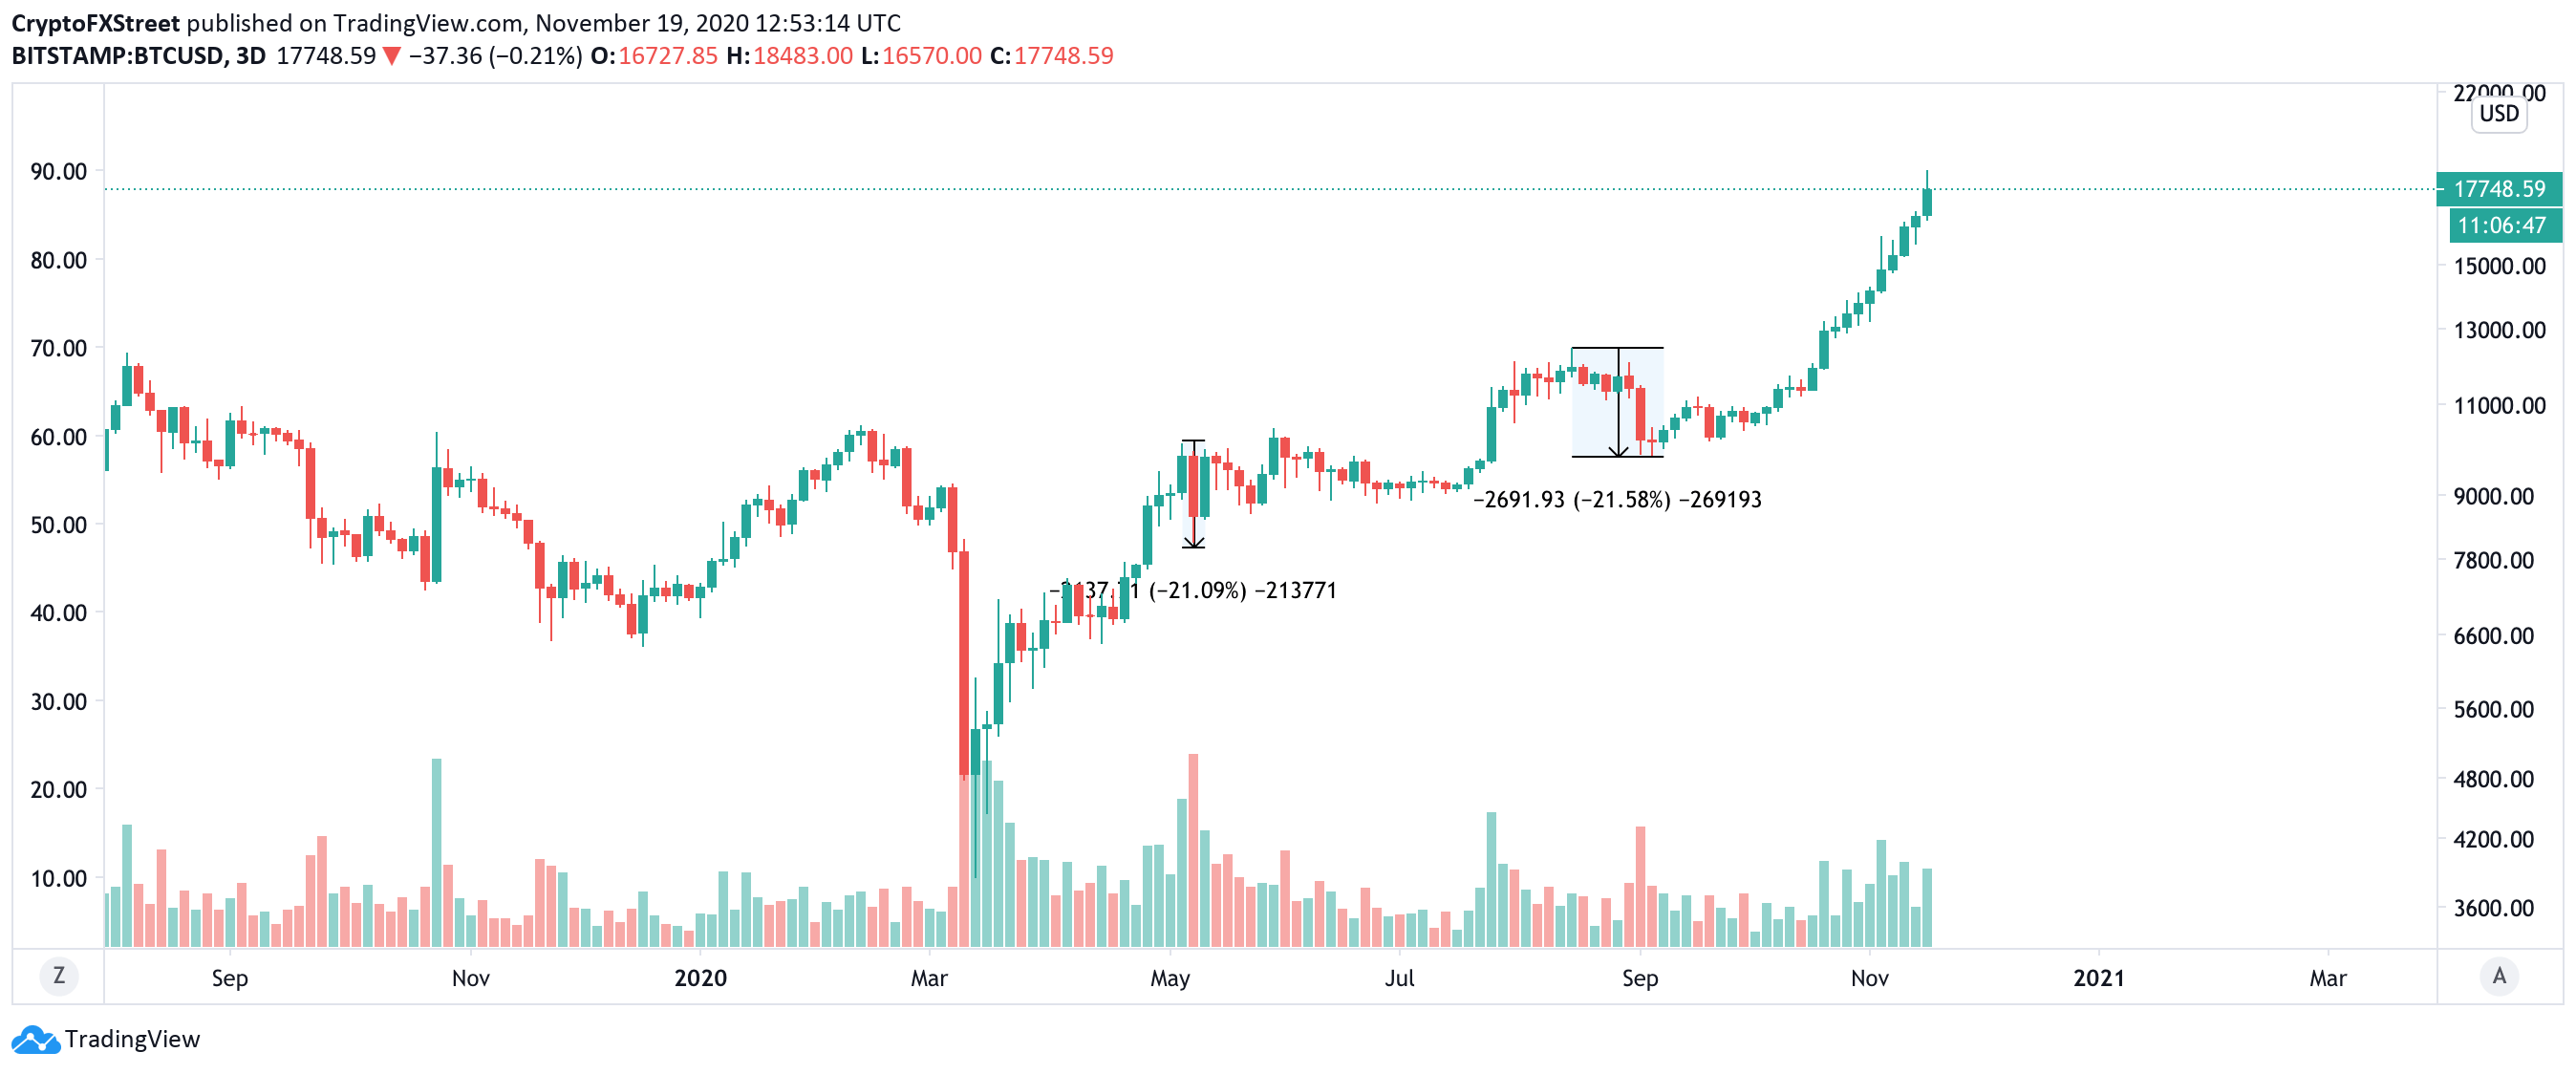
Bitcoin upside trend in 2020
While Bitcoin is now touted as a more mature asset less vulnerable to sharp price swings, the cryptocurrency community should be aware of the potential danger ahead as history tends to repeat, especially when it comes to the financial markets.
Technical indicators scream danger
The technical picture and the recent developments on the cryptocurrency markets support the idea that the price may repeat its Waltz pattern and make another step back before it moves forward and reaches new records.
TD Sequential indicator provides a sell or a buy signal when the price is ready to change its direction. When a green nine candlestick appears on a chart it's a sign for the traders to be aware of a potential downside correction that will result in one to four red candlesticks on a given time frame.
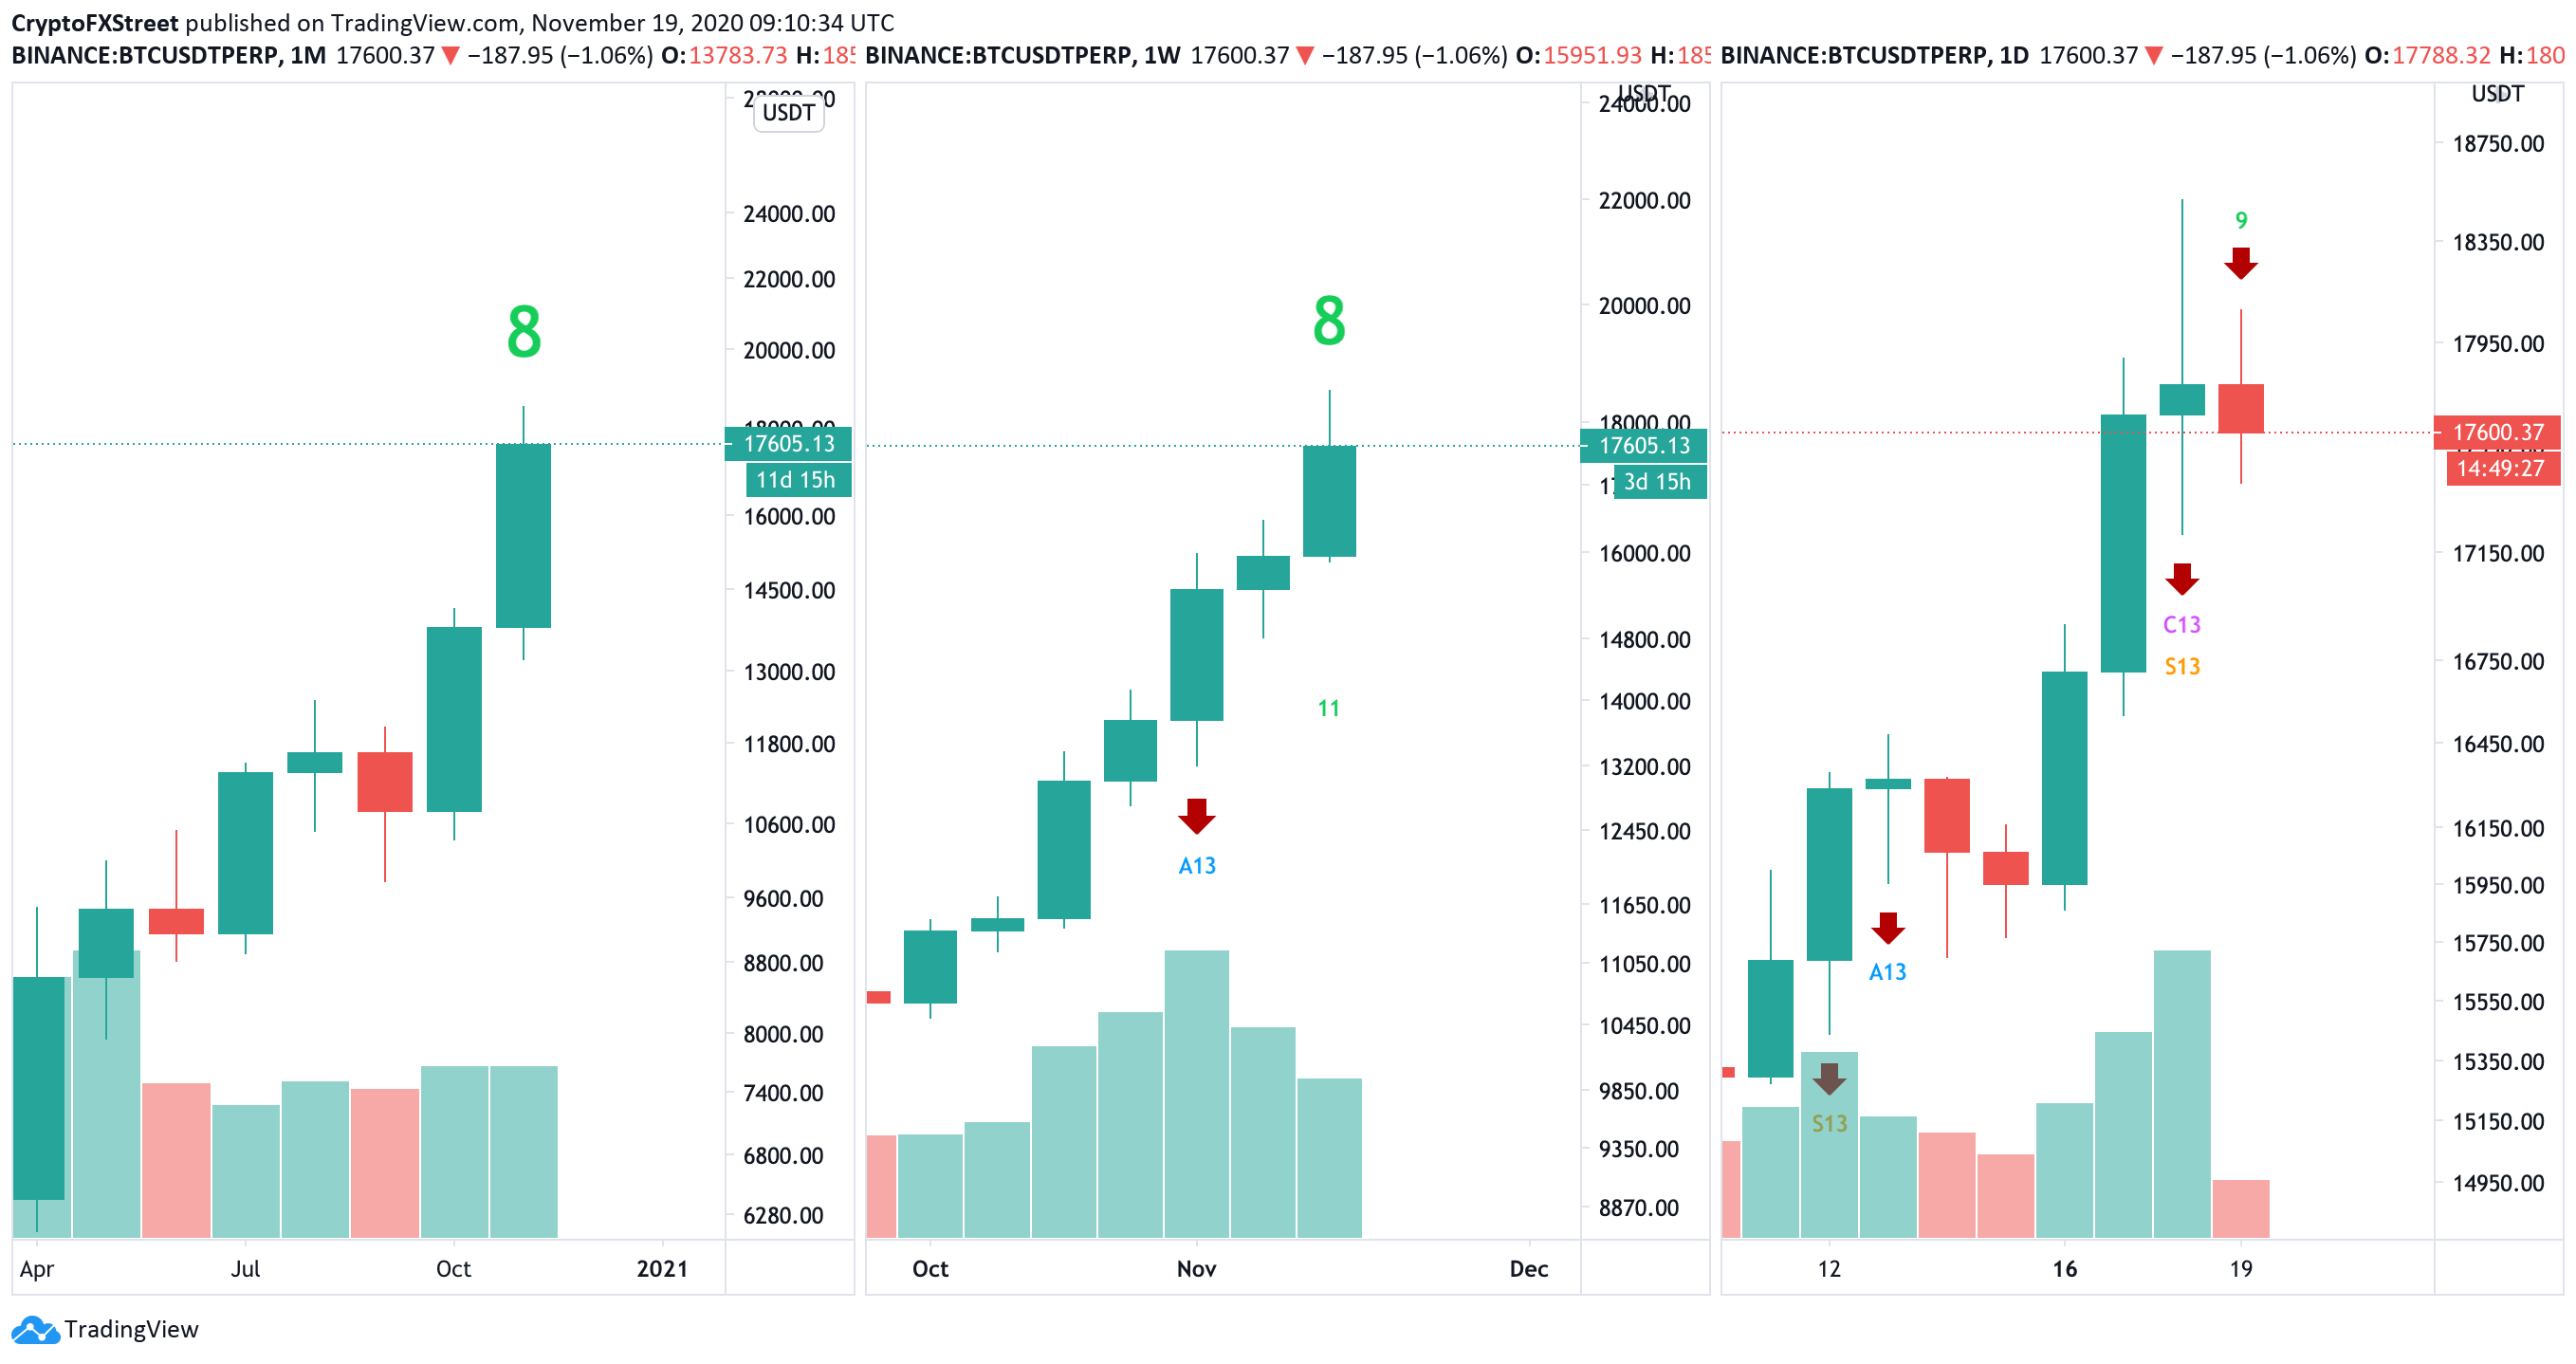
Bitcoin TD Sequential indicator on multiple time frames
The TD sequential indicator chart above suggests that the correction may be on its way as it has already printed a sell signal on the daily chart. Monthly and weekly charts have eight green candlesticks meaning that the price is ready for a long-term setback.
If the bearish scenario starts to play out, the price may enter the Hump, Slump, Pump, and Dump structure identified by the prominent trader and analyst Peter Brandt. He noticed that all the corrections during the 2015-2017 cycle followed a similar pattern, a hump with a slump followed by a pump and finally a dump.
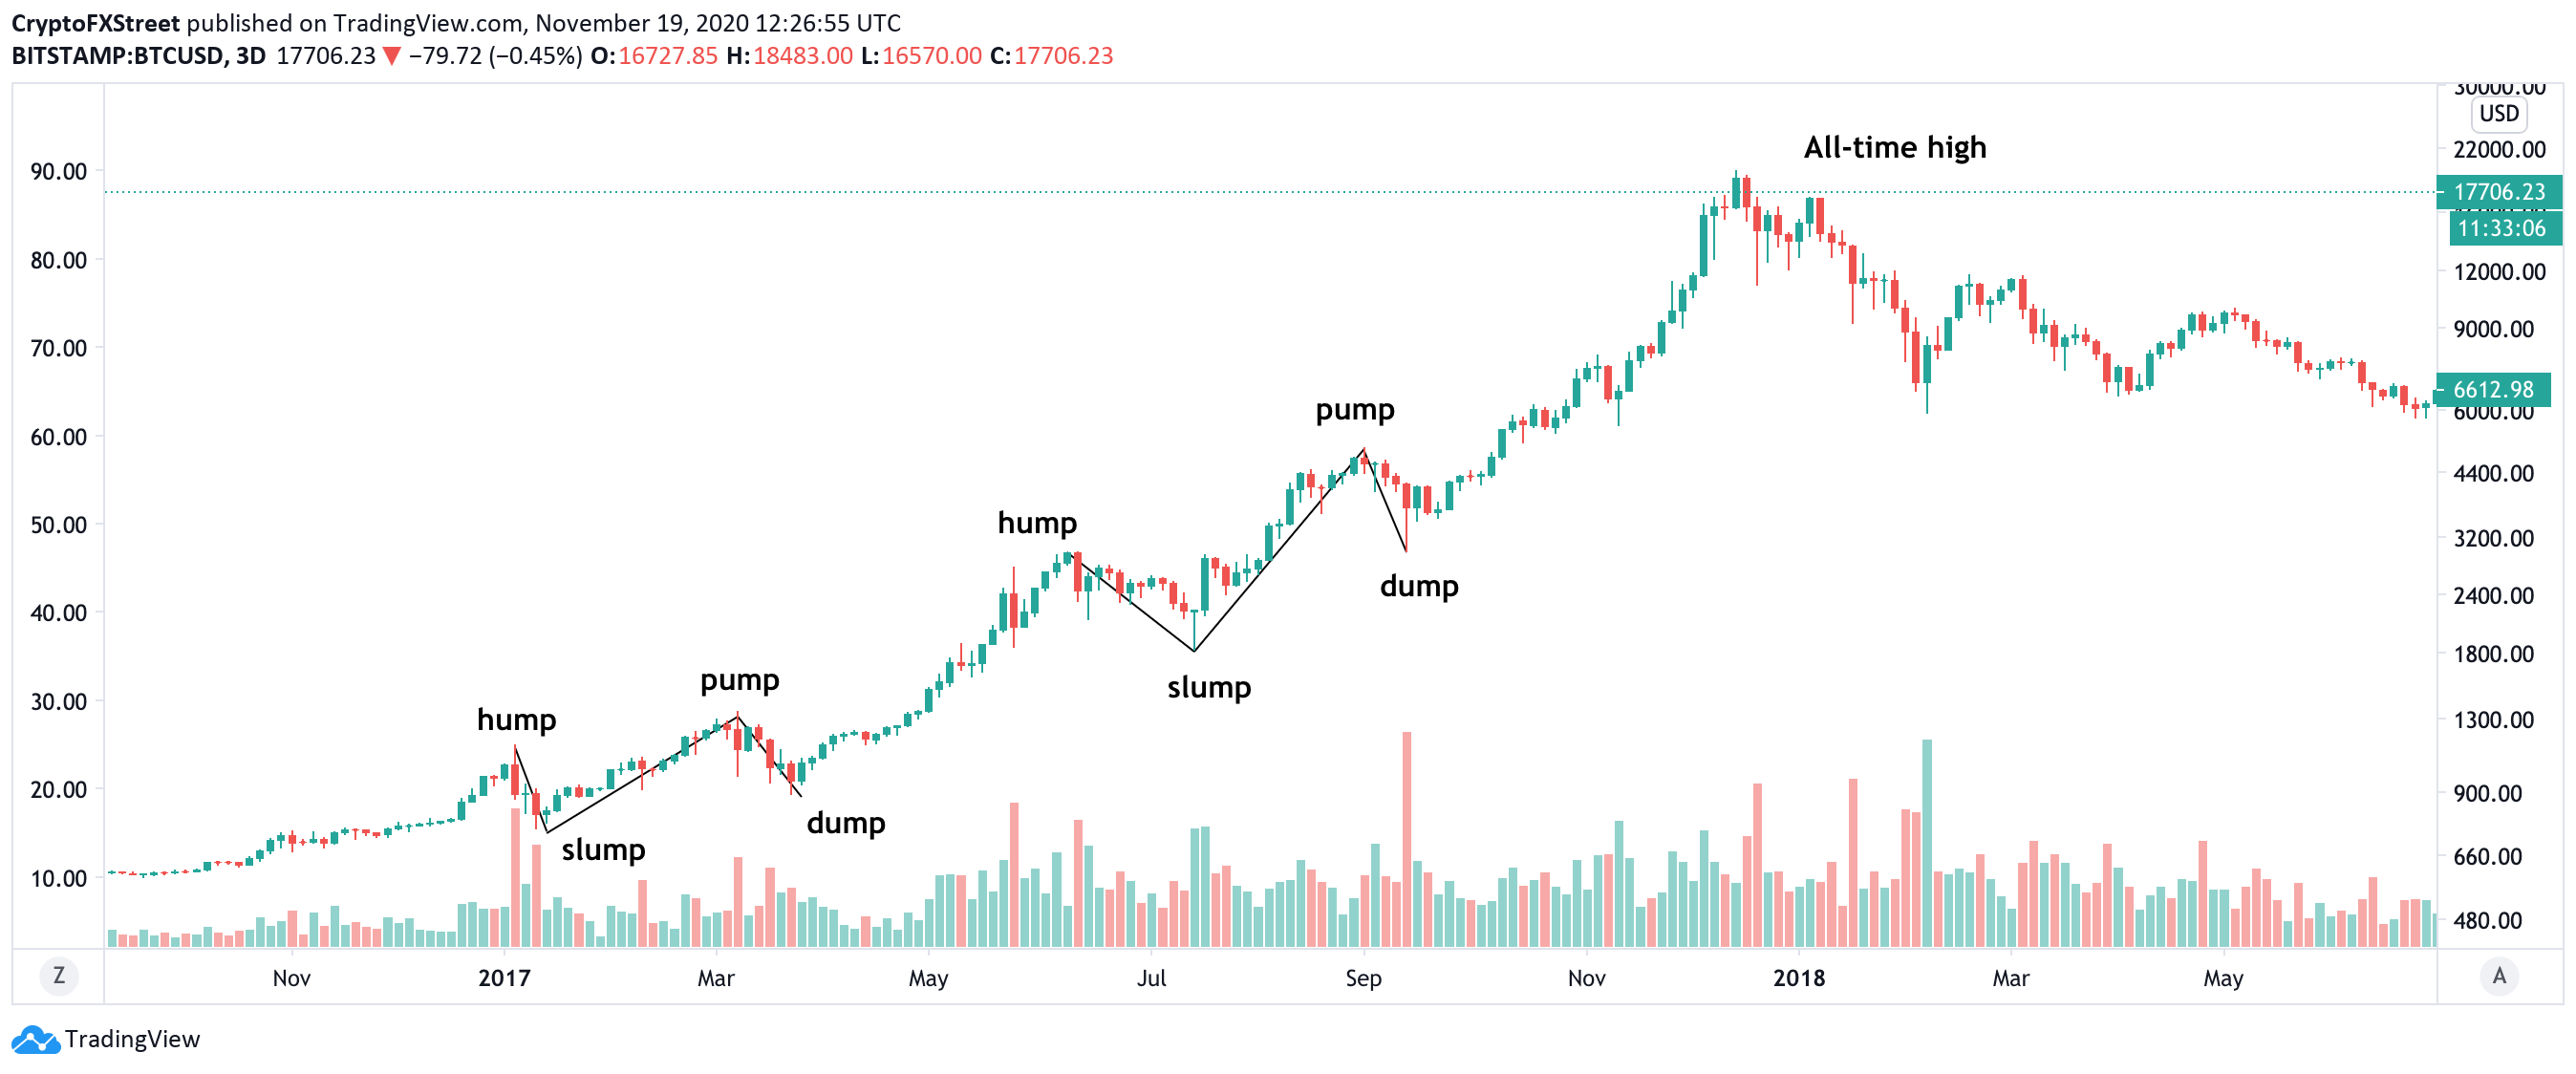
Bitcoin Slump and Dump pattern
Bitcoin price may still go higher before the crash
IntoTheBlock's In/Out of the Money Around Price (IOMAP) model implies that BTC bulls are facing a vital resistance area as nearly 500,000 addresses previously purchased over 370,000 BTC between the current price and $18,000. This supply wall may absorb the buying pressure and trigger the sell-off towards the local support at $17,200, followed by a cluster of barriers that go all the way down to $15,000.
 Analytics and Charts-637413873820650791.png)
Meanwhile, a sustainable move above $18,000 will create strong upside momentum and allow BTC to retest $19,300 with little resistance on the way.
Considering that the sell signal on the weekly chart will be visible in three days, while the monthly one will be finished in 11 days, Bitcoin has the potential to go through another pump and retest the $19,666 all-time high before the dump happens.
Author

Tanya Abrosimova
Independent Analyst


