Bitcoin (BTC) may be consolidating at $47,000, but longer timeframes show just how significant this week’s mini bull run has been.
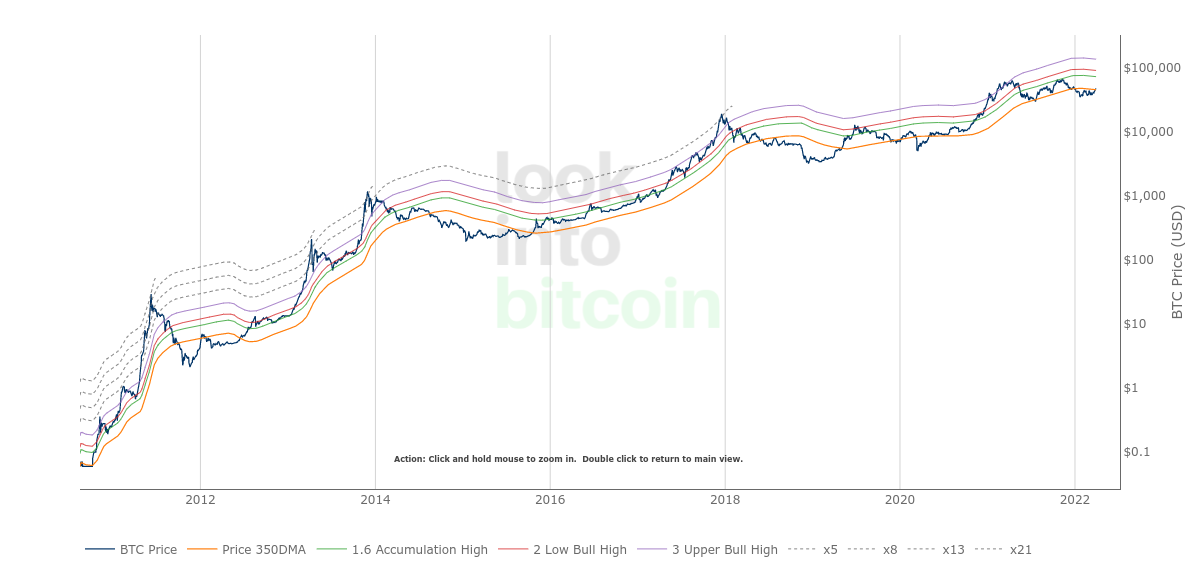
According to the Golden Ratio Multiplier (GRM) metric, on March 27, BTC/USD reclaimed an essential support zone for securing further upside.
Bitcoin exits trendline slump that beat March 2020
GRM is a long-term observational metric for Bitcoin price action. It is used to determine whether Bitcoin price growth (or the opposite) is overstretched relative to its overall maturity as an asset in terms of adoption.
It does so using a log scale, which comprises Bitcoin’s 350-day moving average (DMA) and Fibonacci sequences to give multiples of that trendline.
As such, BTC/USD dropping below the 350DMA is a now conspicuous sign of outlier price action, as the vast majority of days have been spent above it since mid-2019.
As Bitcoin matures and adoption spreads, logarithmic extremes become less pronounced.
“The Golden Ratio Multiplier is an effective tool because it is able to demonstrate when the market is likely overstretched within the context of Bitcoin’s adoption curve growth and market cycles,” analyst Philip Swift, who created the tool in 2019, explained at the time.
The March 2020 COVID-19 crash, for example, had marked Bitcoin’s longest recent trip below the 350DMA, but 2022 managed to beat it by three months to two.
As such, the first three months of this year look like a clear exception to the rule when it comes to GRM.
Another use for GRM is naturally tied to predicting Bitcoin market cycle tops. In 2019, Swift estimated that the next top would be roughly three times the 350DMA.
“If this decreasing Fibonacci sequence pattern continues to play out as it has done over the course of the past 9 years, then the next market cycle high will be when price is in the area of the 350DMA x3,” he reasoned.
Bitcoin Golden Ratio Multiplier chart. Source: LookIntoBitcoin
Weekly chart makes mincemeat of once-solid resistance
On mid-range timeframes, as Cointelegraph reported, Bitcoin is already making a statement when it comes to trendlines in place throughout 2022.
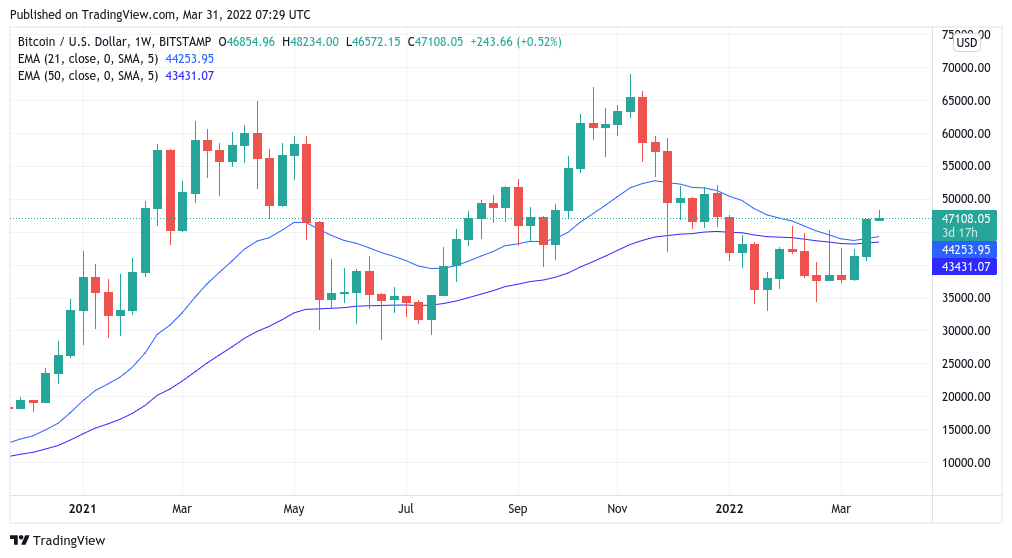
Two MAs providing resistance in Q1 — the 21-week and 50-week exponential MA — saw their first challenge this week, and bulls are currently battling for them as new support, data from Cointelegraph Markets Pro and TradingView shows.
The two roughly divide Bitcoin’s current trading range, in effect since the start of 2021, into two parts with $28,000 and $69,000 as the floor and ceiling, respectively.
Moving above them, popular trader and analyst Rekt Capital previously said, would allow BTC/USD to have a shot at new all-time highs.
“BTC has performed a Weekly Candle Close above the 21-week Bull Market EMA when price is in an uptrend for the first time since mid-July 2021,” he added in an update on the topic this week.
BTC/USD 1-week candle chart (Bitstamp) with 21-week and 50-week EMA. Source: TradingView
Information on these pages contains forward-looking statements that involve risks and uncertainties. Markets and instruments profiled on this page are for informational purposes only and should not in any way come across as a recommendation to buy or sell in these assets. You should do your own thorough research before making any investment decisions. FXStreet does not in any way guarantee that this information is free from mistakes, errors, or material misstatements. It also does not guarantee that this information is of a timely nature. Investing in Open Markets involves a great deal of risk, including the loss of all or a portion of your investment, as well as emotional distress. All risks, losses and costs associated with investing, including total loss of principal, are your responsibility. The views and opinions expressed in this article are those of the authors and do not necessarily reflect the official policy or position of FXStreet nor its advertisers.
Recommended Content
Editors’ Picks

Litecoin Price Prediction: LTC tries to retake $100 resistance as miners halt sell-off
Litecoin price grazed 105 mark on Monday, rebounding 22% from the one-month low of $87 recorded during last week’s market crash. On-chain data shows sell pressure among LTC miners has subsided. Is the bottom in?

Bitcoin fails to recover as Metaplanet buys the dip
Bitcoin price struggles around $95,000 after erasing gains from Friday’s relief rally over the weekend. Bitcoin’s weekly price chart posts the first major decline since President-elect Donald Trump’s win in November.

SEC Commissioner Hester Pierce sheds light on Ethereum ETF staking under new administration
In a Friday interview with Coinage, SEC Commissioner Hester Peirce discussed her optimism about upcoming regulatory changes as the agency transitions to new leadership under President Trump’s pick for new Chair, Paul Atkins.

Bitcoin dives 3% from its recent all-time high, is this the cycle top?
Bitcoin investors panicked after the Fed's hawkish rate cut decision, hitting the market with high selling pressure. Bitcoin's four-year market cycle pattern indicates that the recent correction could be temporary.

Bitcoin: 2025 outlook brightens on expectations of US pro-crypto policy
Bitcoin price has surged more than 140% in 2024, reaching the $100K milestone in early December. The rally was driven by the launch of Bitcoin Spot ETFs in January and the reduced supply following the fourth halving event in April.

Best Forex Brokers with Low Spreads
VERIFIED Low spreads are crucial for reducing trading costs. Explore top Forex brokers offering competitive spreads and high leverage. Compare options for EUR/USD, GBP/USD, USD/JPY, and Gold.

