- According to the Hash Ribbon, on-chain metric, Bitcoin is on the cusp of another rally.
- The Hash Ribbon shows when the worst of miner capitulation is coming to an end.
Bitcoin has slowed down the uptrend after running in immense selling pressure under $19,500. The flagship cryptocurrency has settled around $19,000, awaiting the final leg to new all-time highs beyond $20,000. Meanwhile, Glassnode’s Hash Ribbon on-chain indicator is almost presenting a buy signal since July.
Bitcoin Hash Ribbon turns strongly bullish
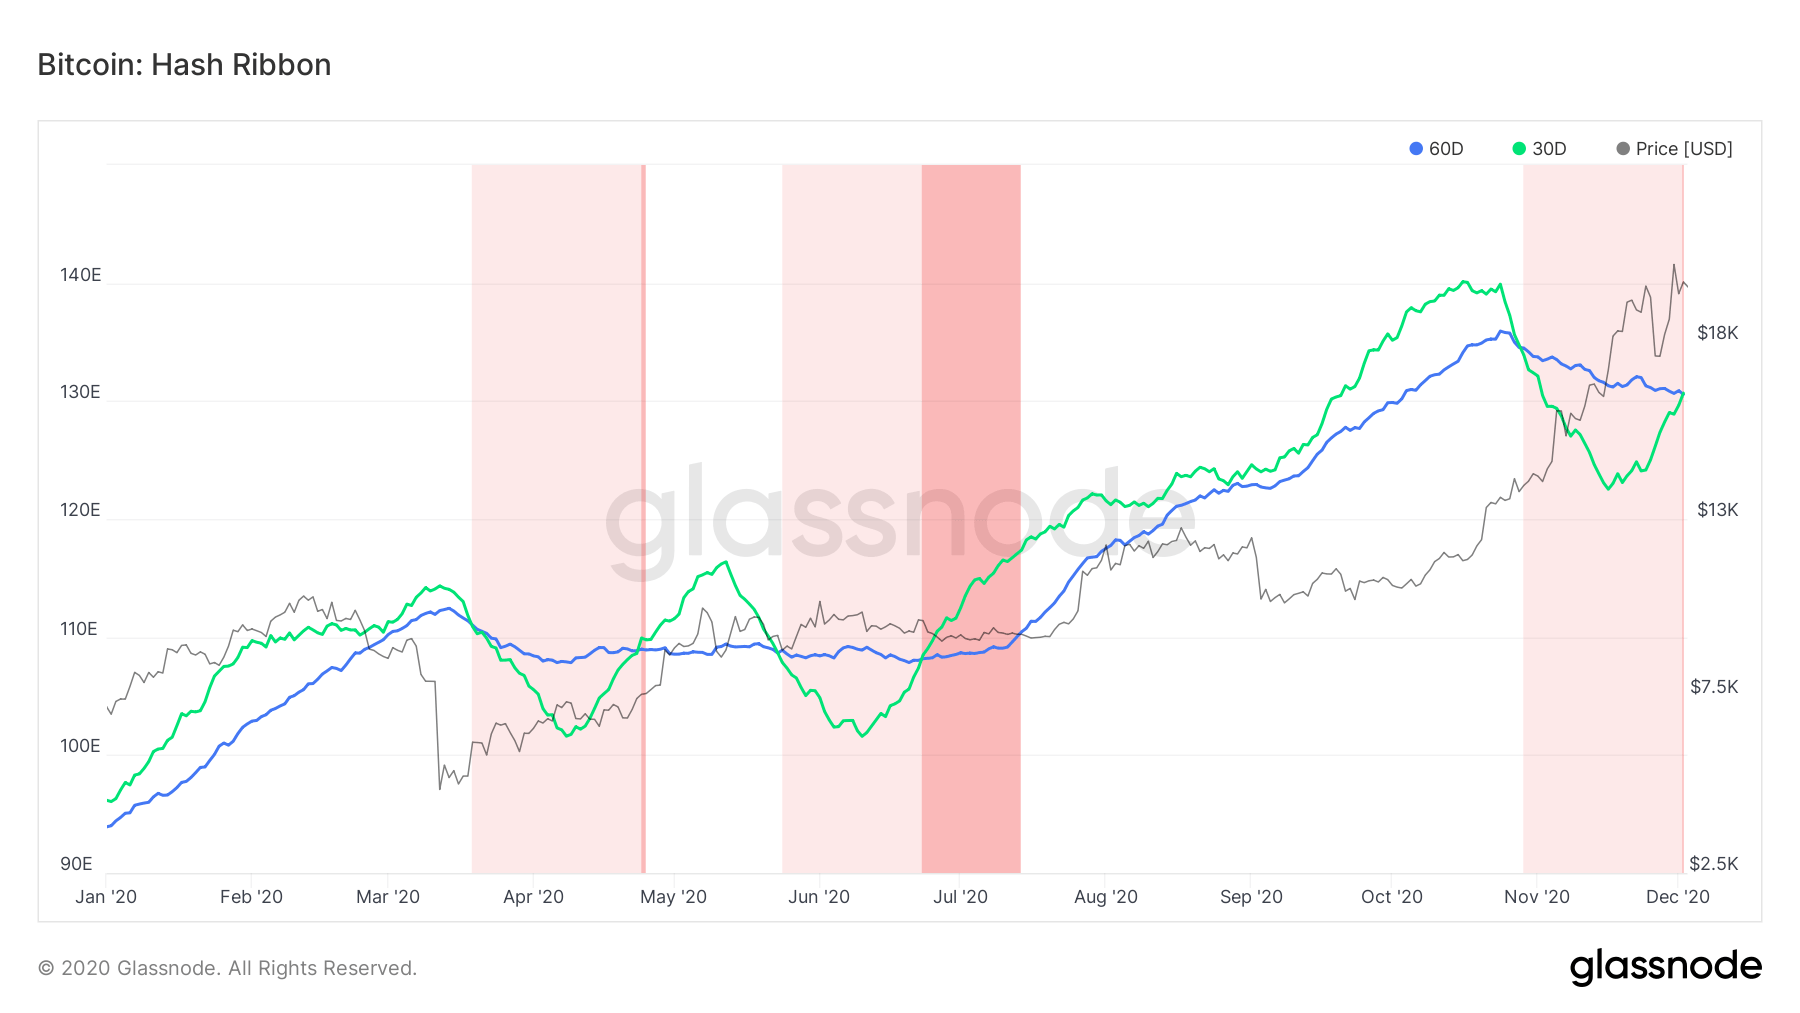
The Hash Ribbon, an on-chain indicator developed by Charles Edwards and presented by Glassnode, suggests that the flagship cryptocurrency tends to hit bottom during miner capitulation. In other words, this is the time “when Bitcoin becomes too expensive to mine relative to the cost of mining.”
Glassnode explains that the miner capitulation ends “when the 30-day Moving Average of the hash rate crosses above the 60-day MA” (observe the chart below for the shift from light red to dark red areas).
Immediately after the switch happens, the momentum of Bitcoin price changes from negative to positive. The indicator presents a considerable buying opportunity following the shift from dark red to white.
Bitcoin Hash Ribbon chart
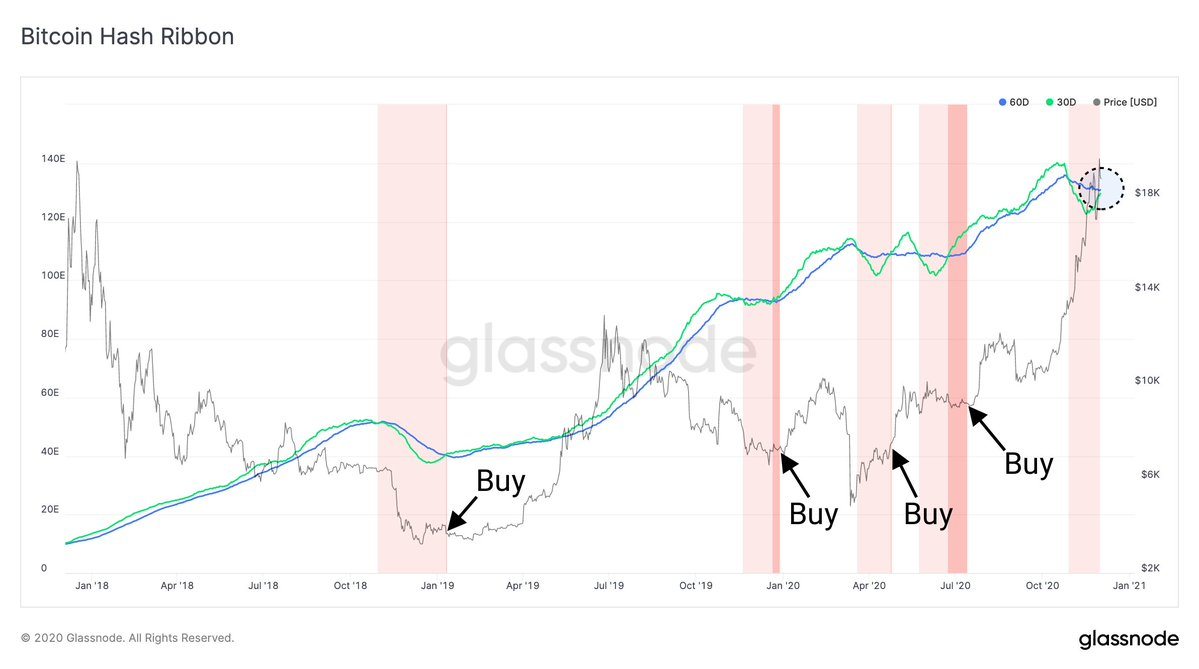
As mentioned above, a buy signal nears when the 30-day MA crosses above the 60-day MA. The chart below highlights this imminent move, as well as a shift from the light red ribbon to the white ribbon. In other words, investors should prepare for a possible liftoff for Bitcoin, perhaps to levels significantly above $20,000.
Bitcoin Hash Ribbon chart
IntoTheBlock’s IOMAP chart adds credibility to the bullish outlook by revealing the lack of formidable resistance heading to $20,000. The most robust hurdle runs from $19,272 to $19,310. Here, 311 addresses had previously purchased roughly 2,700 BTC.
-637425717087691394.png)
Bitcoin IOMAP chart
On the flip side, immense support is accorded to the bellwether cryptocurrency. Thus it is doubtful that massive losses will come into the picture in the near term. For now, the most substantial buyer congestion zone lies between $18,558 and $19,118. Here, 1.4 million addresses had previously purchased approximately 792,000 BTC.
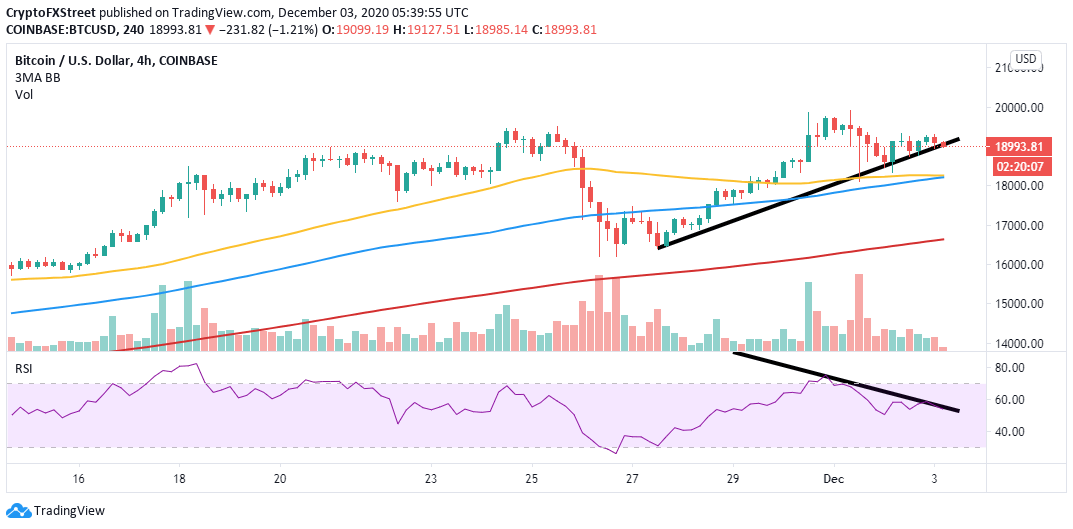
It is worth mentioning that short-term analysis for BTC/USD brings to light a worsening technical picture. The bullish outlook will be invalidated if BTC closed the day under the short term ascending trendline support and the critical level at $19,000.
BTC/USD 4-hour chart
Similarly, a bearish divergence has been formed by the Relative Strength Index and the price, suggesting that buying pressure is decreasing. Bearish divergences are created when the RSI sustains a lower high pattern while the price prints a higher low pattern.
As the bullish momentum dwindles, bears gain more control over the price, which may eventually push Bitcoin to spiral to $18,000 and $16,000, respectively.
Information on these pages contains forward-looking statements that involve risks and uncertainties. Markets and instruments profiled on this page are for informational purposes only and should not in any way come across as a recommendation to buy or sell in these assets. You should do your own thorough research before making any investment decisions. FXStreet does not in any way guarantee that this information is free from mistakes, errors, or material misstatements. It also does not guarantee that this information is of a timely nature. Investing in Open Markets involves a great deal of risk, including the loss of all or a portion of your investment, as well as emotional distress. All risks, losses and costs associated with investing, including total loss of principal, are your responsibility. The views and opinions expressed in this article are those of the authors and do not necessarily reflect the official policy or position of FXStreet nor its advertisers. The author will not be held responsible for information that is found at the end of links posted on this page.
If not otherwise explicitly mentioned in the body of the article, at the time of writing, the author has no position in any stock mentioned in this article and no business relationship with any company mentioned. The author has not received compensation for writing this article, other than from FXStreet.
FXStreet and the author do not provide personalized recommendations. The author makes no representations as to the accuracy, completeness, or suitability of this information. FXStreet and the author will not be liable for any errors, omissions or any losses, injuries or damages arising from this information and its display or use. Errors and omissions excepted.
The author and FXStreet are not registered investment advisors and nothing in this article is intended to be investment advice.
Recommended Content
Editors’ Picks

Trump calls for US Dollar dominance, vows to make America a crypto superpower in historic crypto summit speech
US President Donald Trump says America will dominate crypto and become the crypto capital of the world. Trump highlights key initiatives, including the White House Crypto Summit, the end of Operation Chokepoint 2.0 and an executive order on Strategic Bitcoin Reserve.

Crypto Today: After $300M liquidations, BTC, ETH, XRP prices on edge as Trump speaks at Crypto Summit
Cryptocurrency sector’s valuation consolidated at $2.9 trillion on Thursday after the Fed interest rate pause boosted market activity. Liquidations hit $335 million in the last 24 hours, with $207 million in short contracts closed accounting for nearly 60% of the losses.

These crypto categories rallied over 50% in a day: Watch for gains
Crypto traders rejoiced as Bitcoin’s (BTC) price climbed above support at $85,000 following the Federal Reserve’s (Fed) decision to keep interest rates steady and stick to their guidance of two interest rate cuts this year on Wednesday.
Bitcoin hovers above $85,500 as Trump calls the Fed to lower interest rates
Bitcoin price edges lower around $85,500 on Thursday after gaining nearly 5% the previous day. US President Trump called on the Fed to lower interest rates as tariffs start to hurt the economy.

Bitcoin: BTC at risk of $75,000 reversal as Trump’s trade war overshadows US easing inflation
Bitcoin price remained constrained within a tight 8% channel between $76,000 and $84,472 this week. With conflicting market catalysts preventing prolonged directional swings, here are key factors that moved BTC prices this week, as well as key indicators to watch in the weeks ahead.

The Best brokers to trade EUR/USD
SPONSORED Discover the top brokers for trading EUR/USD in 2025. Our list features brokers with competitive spreads, fast execution, and powerful platforms. Whether you're a beginner or an expert, find the right partner to navigate the dynamic Forex market.