Bitcoin (BTC $25,893) tried to break out of its range in the first half of last week, but the bulls could not sustain the higher levels. Bitcoin is back inside the range and is trading near the $26,000 level.
The price action of the past few days has formed two successive Doji candlestick patterns on the weekly chart, indicating uncertainty about the next directional move.
Although it is difficult to predict the direction of the breakout, the downside could be limited in the near term on expectations that the United States Securities and Exchange Commission (SEC) may eventually approve one or more pending applications for a spot Bitcoin exchange-traded fund.
Former commission chair Jay Clayton sounded confident when he said in a recent interview that “an approval is inevitable.”
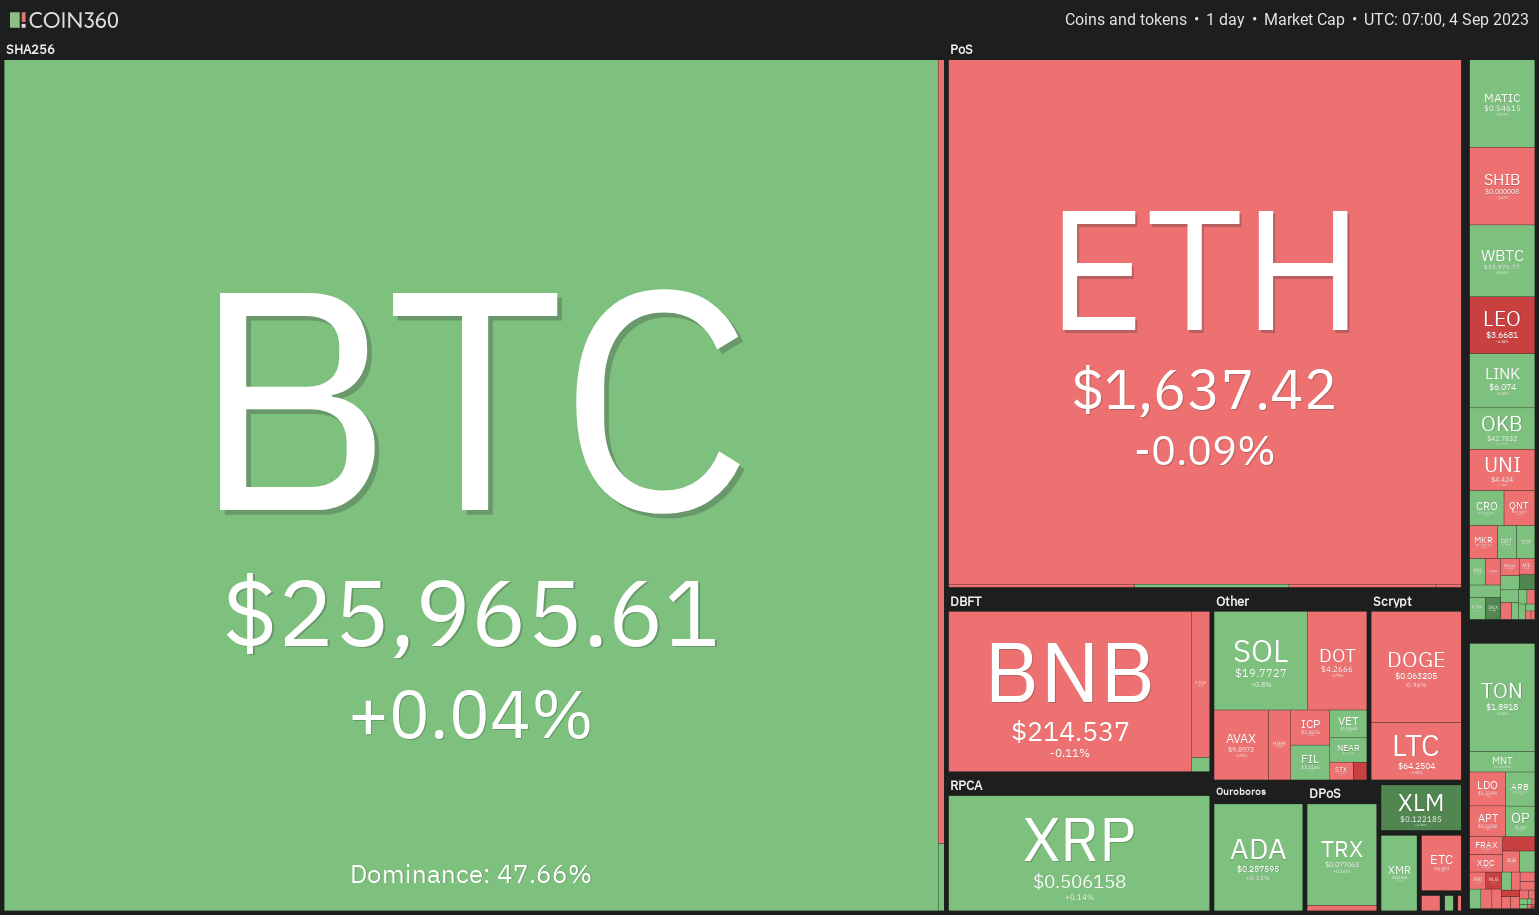
Crypto market data daily view. Source: Coin360
In the near term, it isn’t easy to pinpoint a specific catalyst that could shake Bitcoin out of its range. The lack of clarity about Bitcoin’s next trending move has pressured most major altcoins.
Only a handful of altcoins are showing signs of strength in the short term. Let’s study the charts of the top five cryptocurrencies that may start a rally if they break above their respective overhead resistance levels.
Bitcoin price analysis
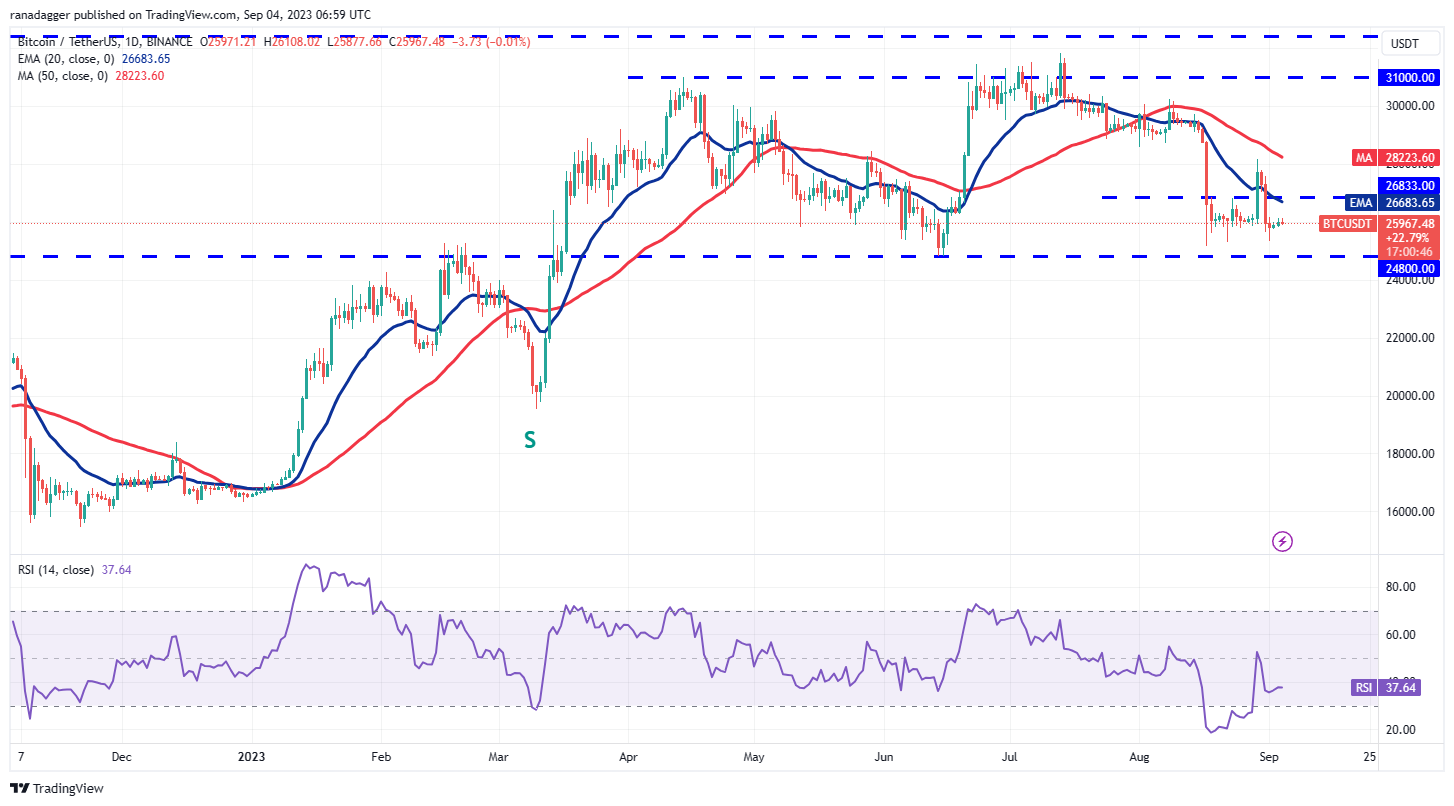
Bitcoin is back inside the $24,800 to $26,833 range, but a positive sign is that the bulls continue to buy the dips, as seen from the long tail on the Sep. 1 candlestick.
BTC/USDT daily chart. Source: TradingView
Although the downsloping moving averages indicate an advantage to bears, the gradually recovering relative strength index (RSI) shows that the bearish momentum may be weakening. The first sign of strength will be a break and close above the range at $26,833. If that happens, the BTC/USDT pair could retest the Aug. 29 intraday high of $28,142.
If bears want to seize control, they will have to sink and sustain the price below $24,800. This is going to be tough as the bulls are likely to defend the level with all their might. Still, if the bears prevail, the pair can plunge to $20,000. There is a minor support at $24,000, but it may not halt the decline.
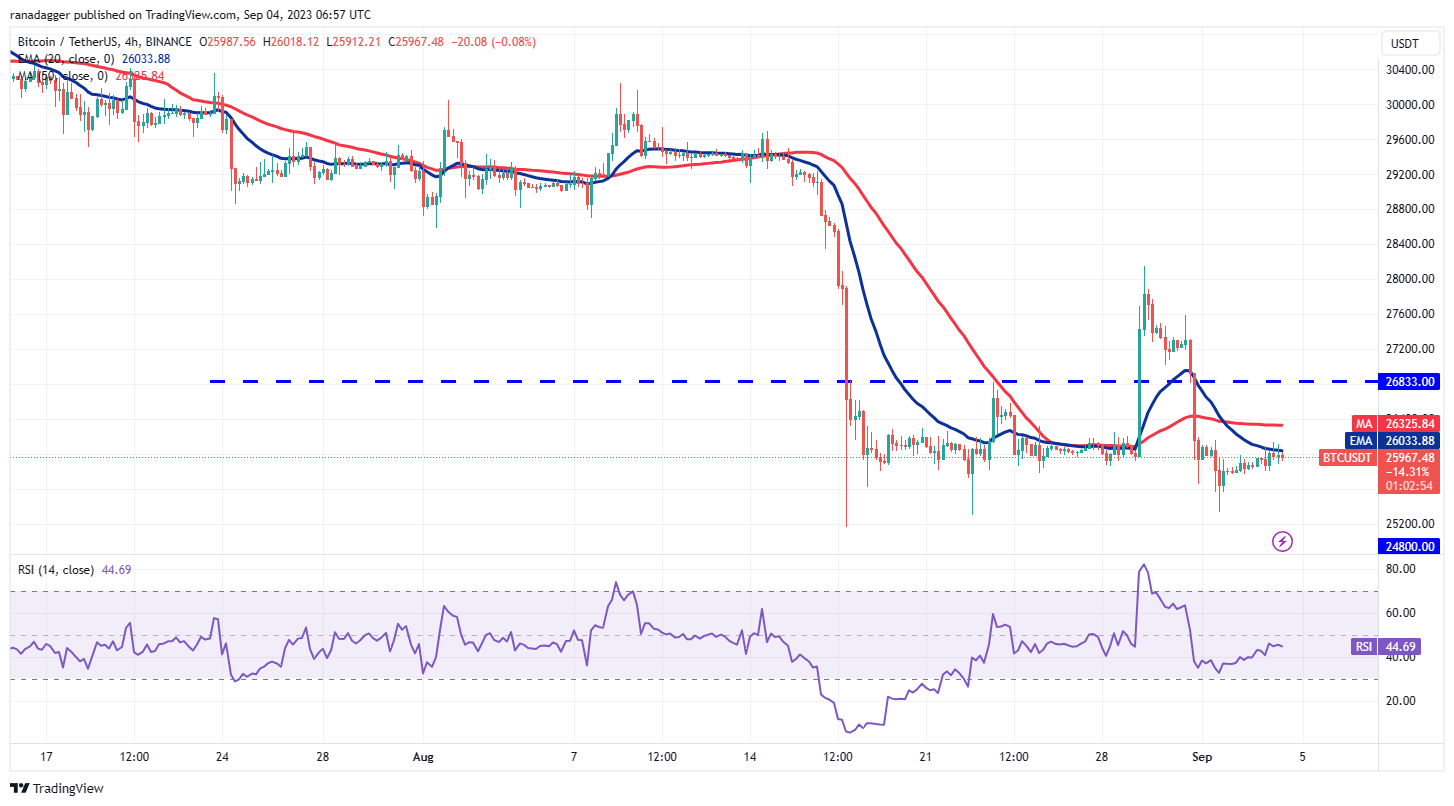
BTC/USDT 4-hour chart. Source: TradingView
The bears tried to pull the price below the immediate support at $25,300, but the bulls held their ground. Buyers will next try to strengthen their position by driving the price above the 20-exponential moving average. If they do that, it will indicate the start of a stronger recovery.
The 50-day simple moving average may act as a roadblock but it is expected to be crossed. The pair could then rally to the overhead resistance at $26,833.
Sellers are likely to have other plans. They will try to sink the price below $25,300 and challenge the vital support at $24,800.
Toncoin price analysis
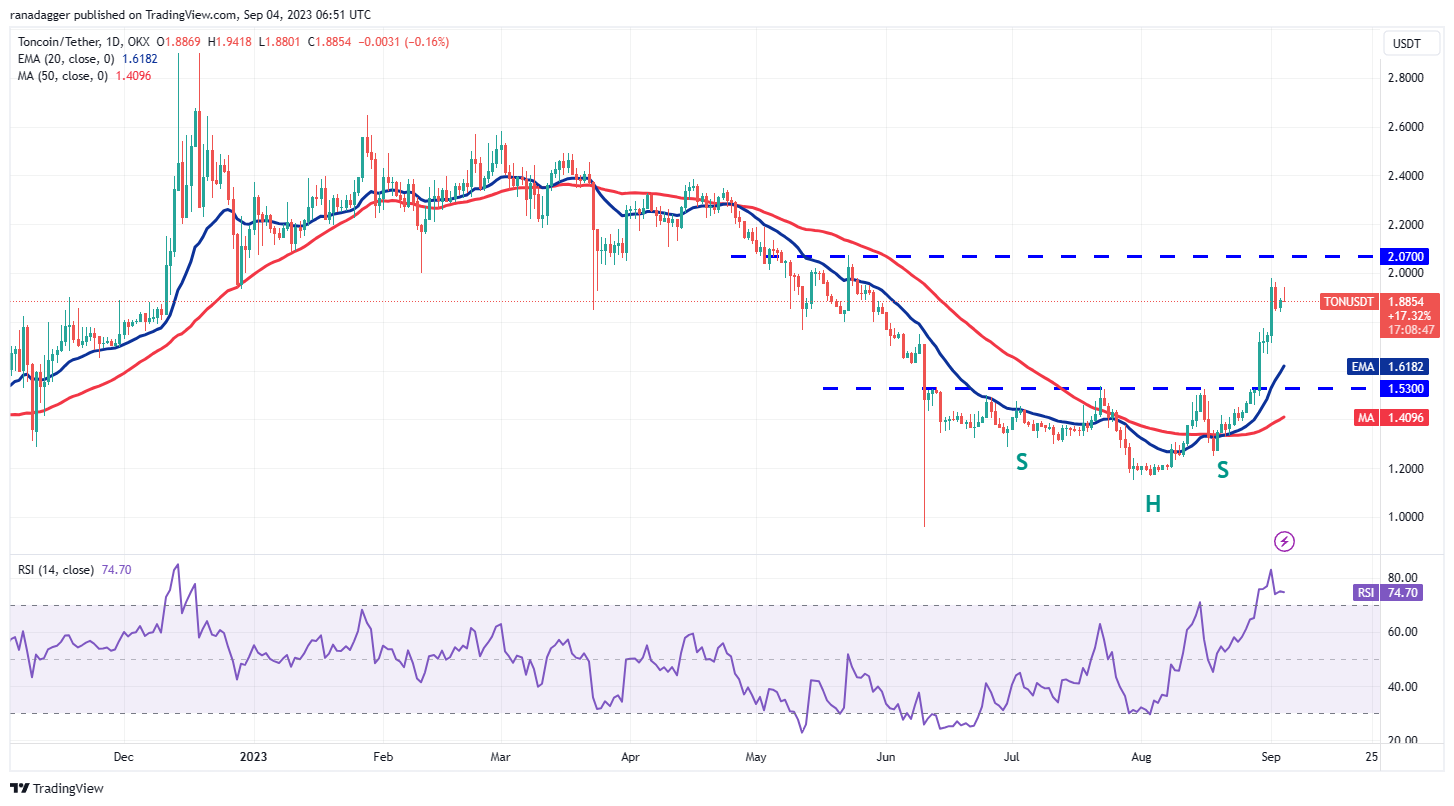
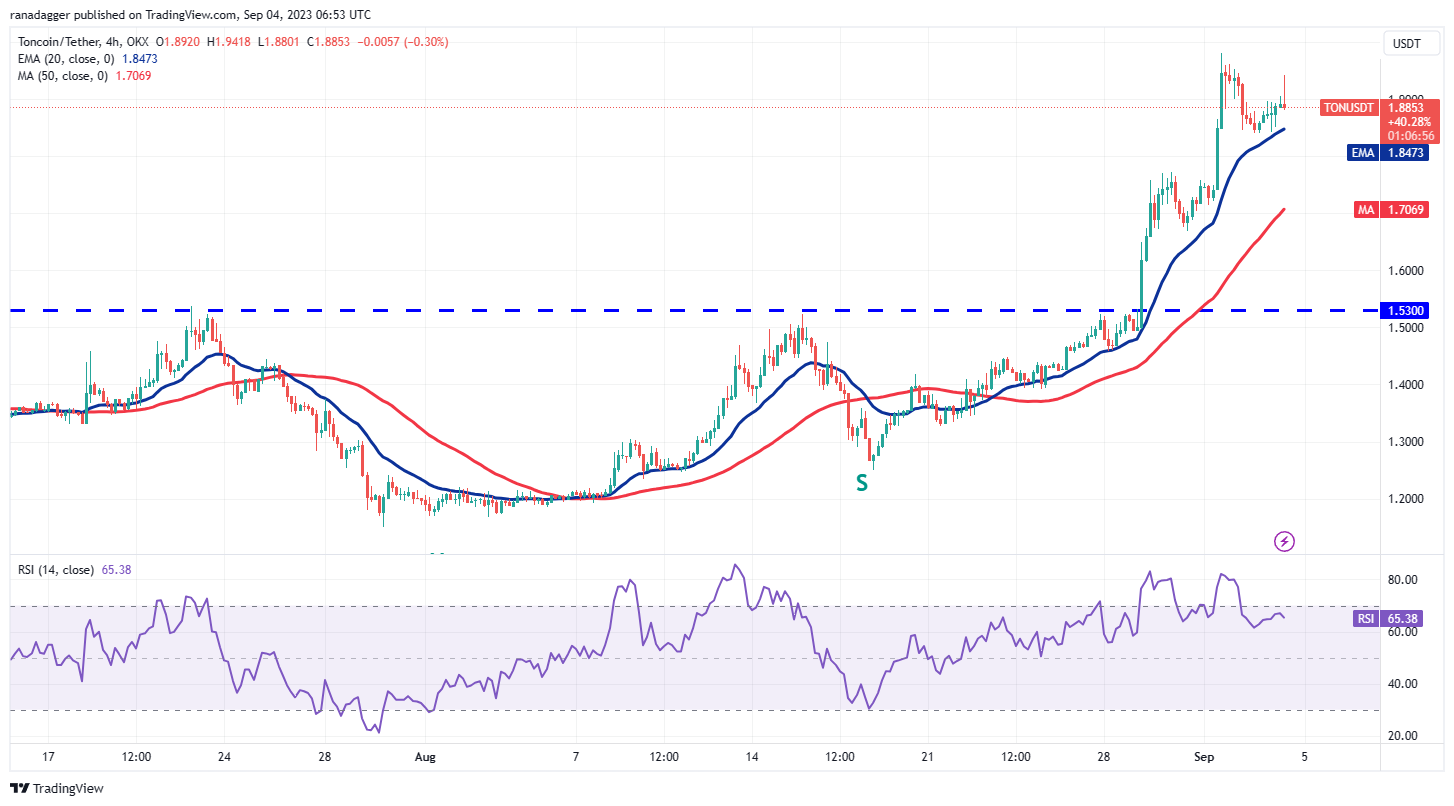
Toncoin (TON) is in an uptrend, but the bears are trying to halt the up-move near the overhead resistance at $2.07.
TON/USDT daily chart. Source: TradingView
Both moving averages have turned up, indicating an advantage to buyers, but the overbought levels on the RSI suggest that a minor correction or consolidation is possible. If the bulls do not give up much ground from the current level, the likelihood of a rally above $2.07 increases. The TON/USDT pair could then soar to $2.40.
Contrarily, a deeper correction may pull the price to the 20-day EMA ($1.61). A strong bounce off this level will suggest that the sentiment remains positive and traders are buying on dips. The trend will turn negative if the 20-day EMA support cracks.
TON/USDT 4-hour chart. Source: TradingView
The 4-hour chart shows that the bulls have been buying the pullback to the 20-EMA. Buyers will have to push the price above $1.98 to signal the resumption of the uptrend, but the bears may not give up easily.
Sellers will try to pull the price below the 20-EMA. If they manage to do that, the pair could start a deeper pullback toward the 50-SMA. A bounce off this level is likely to face selling at the 20-EMA, but if this roadblock is cleared, it will suggest that bulls are back in the driver’s seat.
Chainlink price analysis
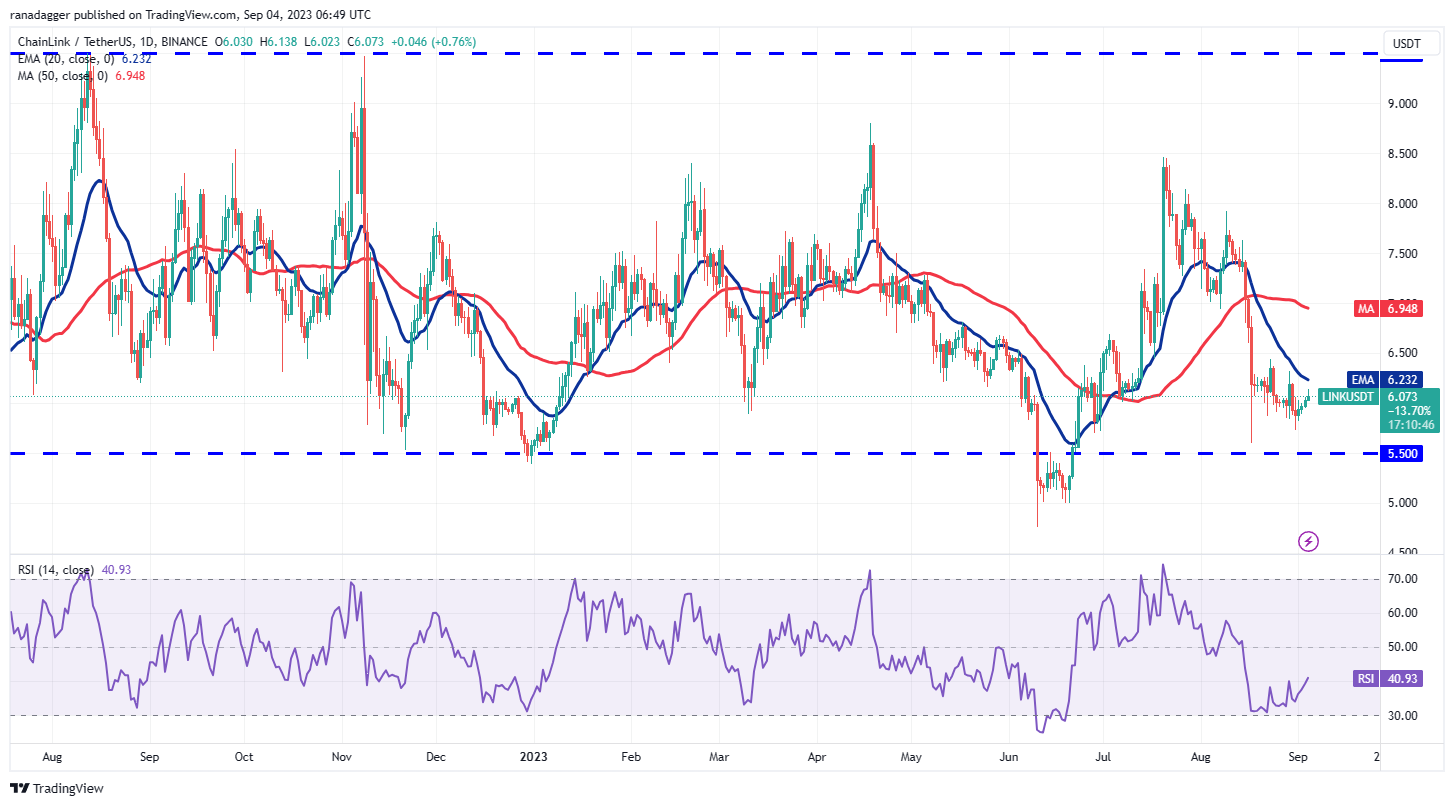
Chainlink’s (LINK $6.13) has been trading inside a large range between $5.50 and $9.50 for the past several months. The bears pulled the price below the support of the range on June 10, but they could not sustain the lower levels.
LINK/USDT daily chart. Source: TradingView
The LINK/USDT pair dropped close to the support of the range on Aug. 17, but the bulls bought this dip, as seen from the long tail on the day’s candlestick. Buyers are trying to start a recovery but are facing resistance near the 20-day EMA ($6.23). Hence, this becomes an important level to look out for.
If buyers propel the price above the 20-day EMA, the pair can start its journey toward the 50-day SMA ($6.94). There is a minor resistance at $6.40, but it is likely to be crossed.
On the contrary, if the price turns down sharply from the 20-day EMA, it will suggest that the sentiment remains negative and traders are selling on rallies. That could pull the price down to $5.50.
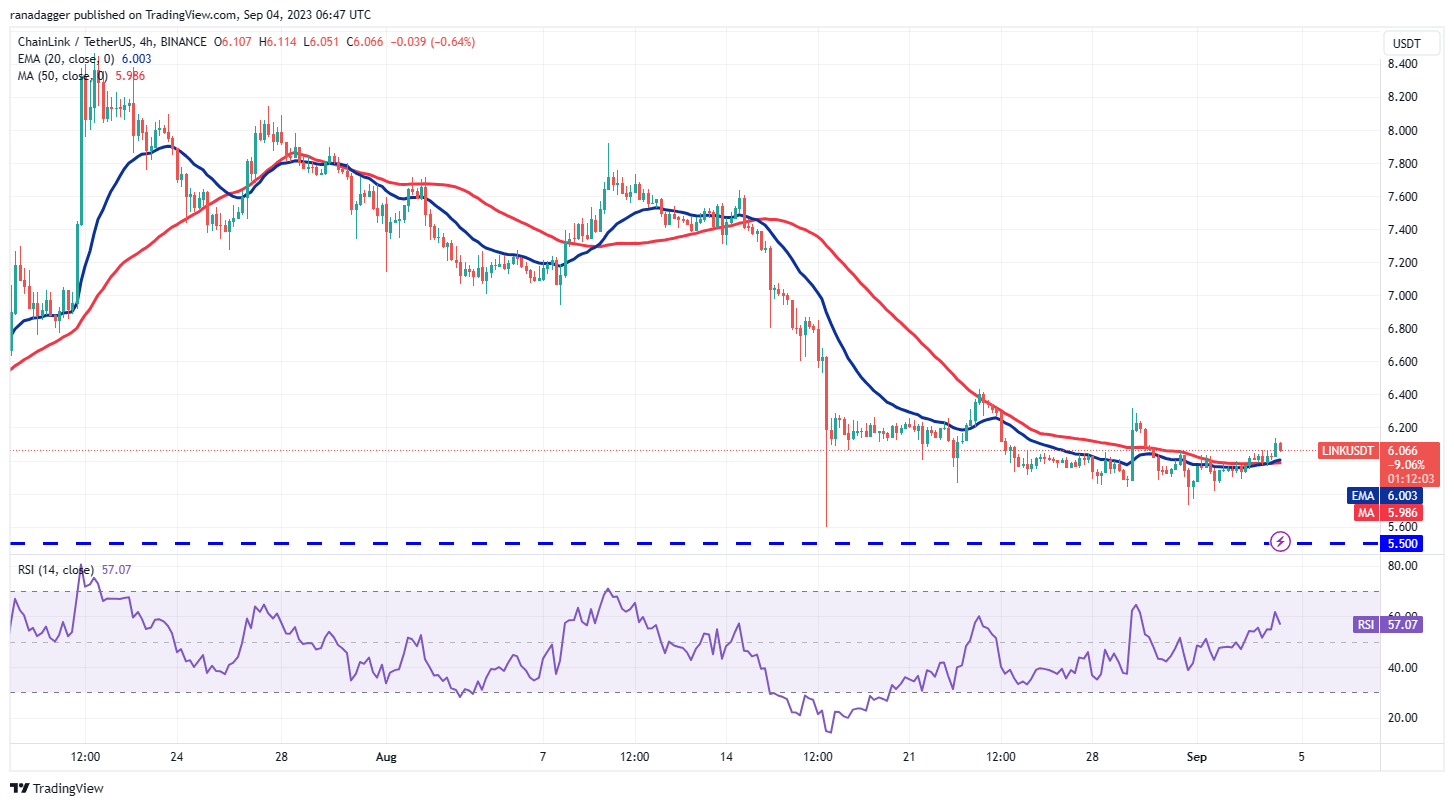
LINK/USDT 4-hour chart. Source: TradingView
The moving averages have flattened out on the 4-hour chart and the RSI is just above the midpoint. This suggests that the selling pressure is reducing. Buyers will have to kick the price above $6.40 to start a new up-move. The pair could first rise to $6.87 and later to $7.07.
Alternatively, if the price turns down from $6.40, it will signal that bears are selling on rallies. That may keep the pair range-bound between $5.50 and $6.40 for a while longer.
Maker price analysis
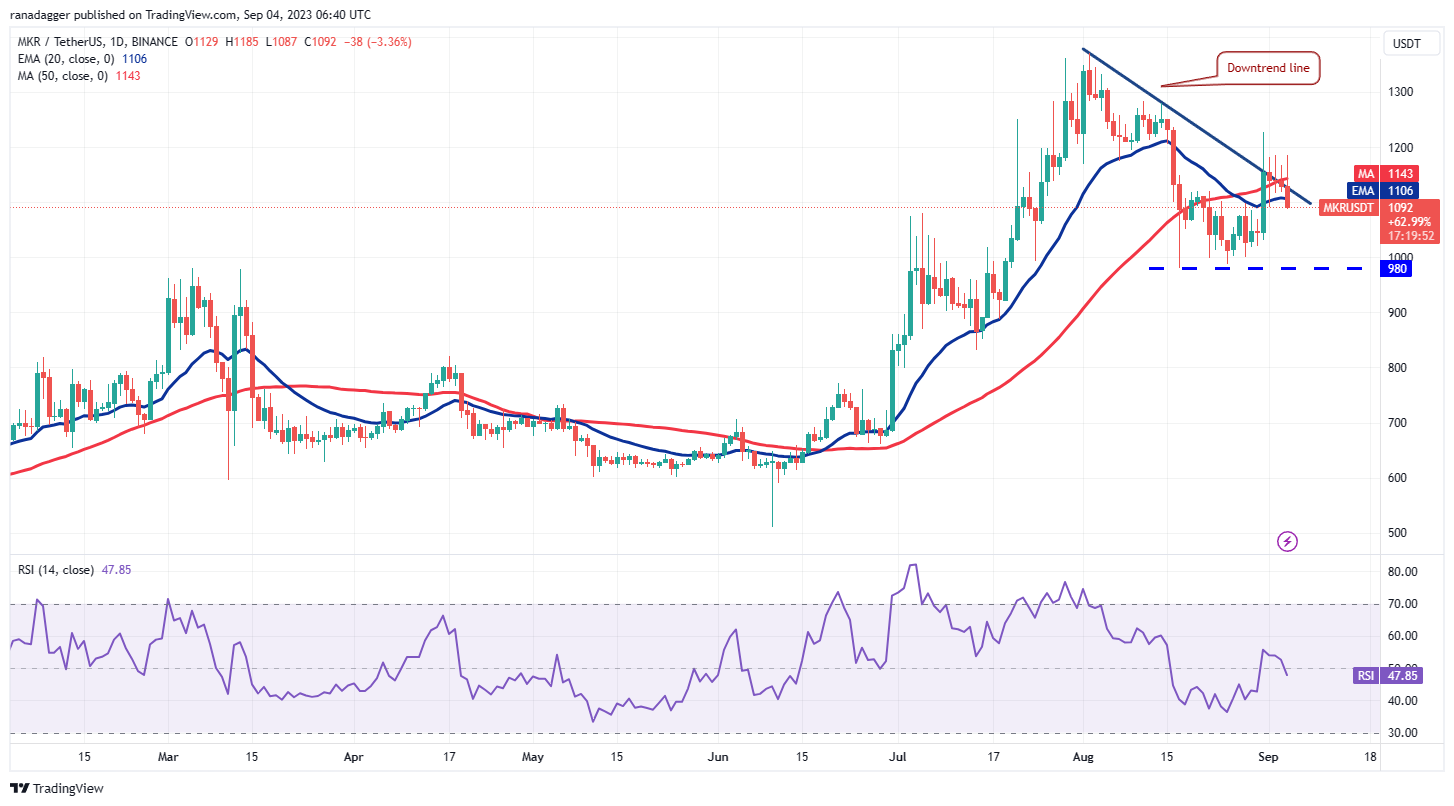
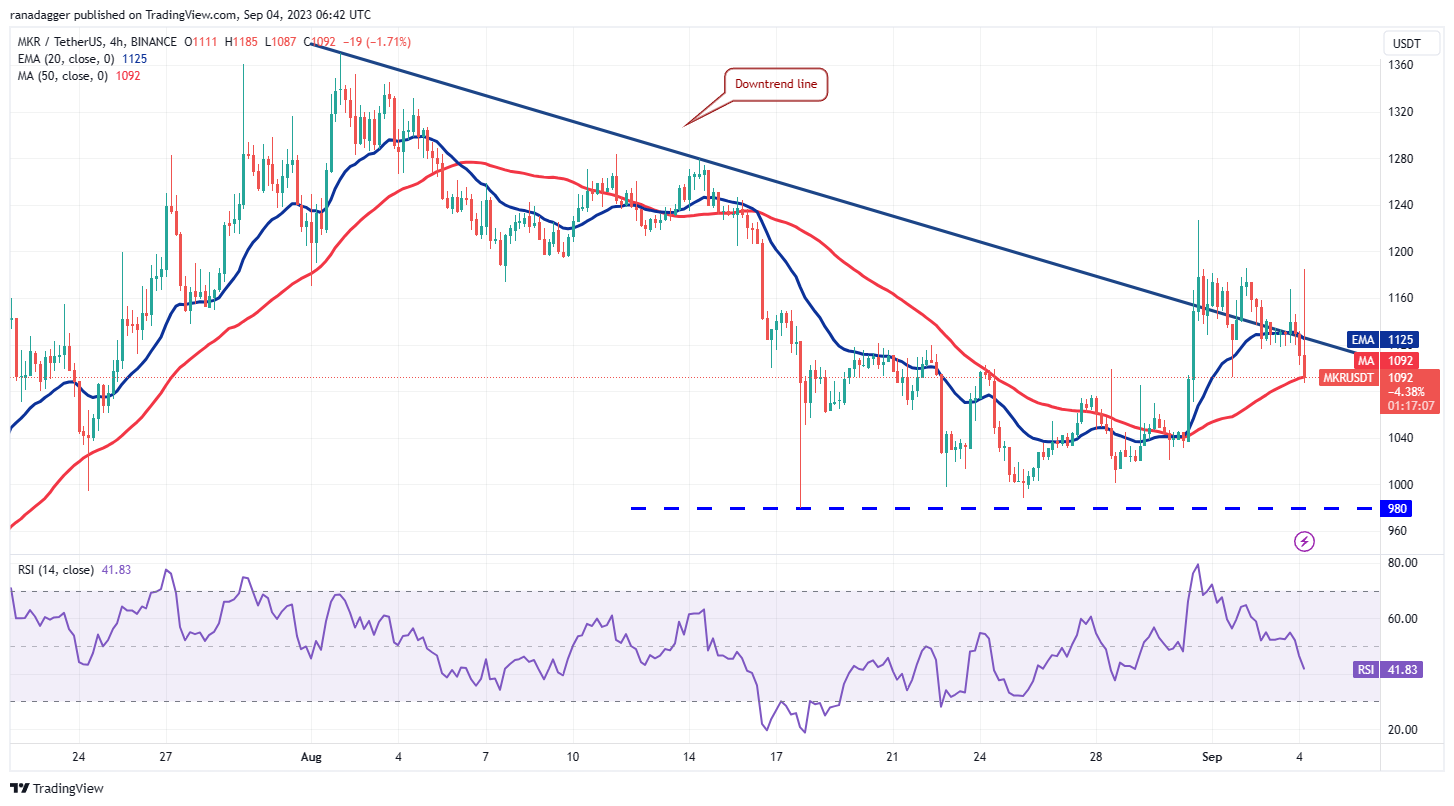
Maker (MKR $1,134) has taken support near $1,000, but the bulls are facing solid resistance from the bears near the downtrend line.
MKR/USDT daily chart. Source: TradingView
The bulls repeatedly pushed the price above the downtrend line in the past few days but failed to sustain the higher levels. A minor positive is that buyers have not given up much ground, which suggests that traders are not dumping their positions in a hurry.
If the price turns up and closes above the downtrend line, it will suggest that buyers are back in the game. The positive momentum is likely to pick up after buyers kick the price above $1,227. The pair may then rally to $1,370.
Instead, if the price sustains below the 20-day EMA ($1,106), it will suggest that bears have the upper hand. The pair could then slump to the strong support at $980.
MKR/USDT 4-hour chart. Source: TradingView
The 4-hour chart shows that the bulls pushed the price above the downtrend line but could not sustain the higher levels. This indicates that the bears have not given up and continue to sell on rallies.
The price has plunged to the 50-SMA, which is an important level to keep an eye on. If the price turns up from the current level, the bulls will again try to overcome the obstacle at $1,186 and then at $1,227. If this zone is scaled, the rally could reach $1,280.
Conversely, if the price sustains below the 50-SMA, it will open the gates for a potential decline to $1,040 and eventually to $980.
Tezos price analysis
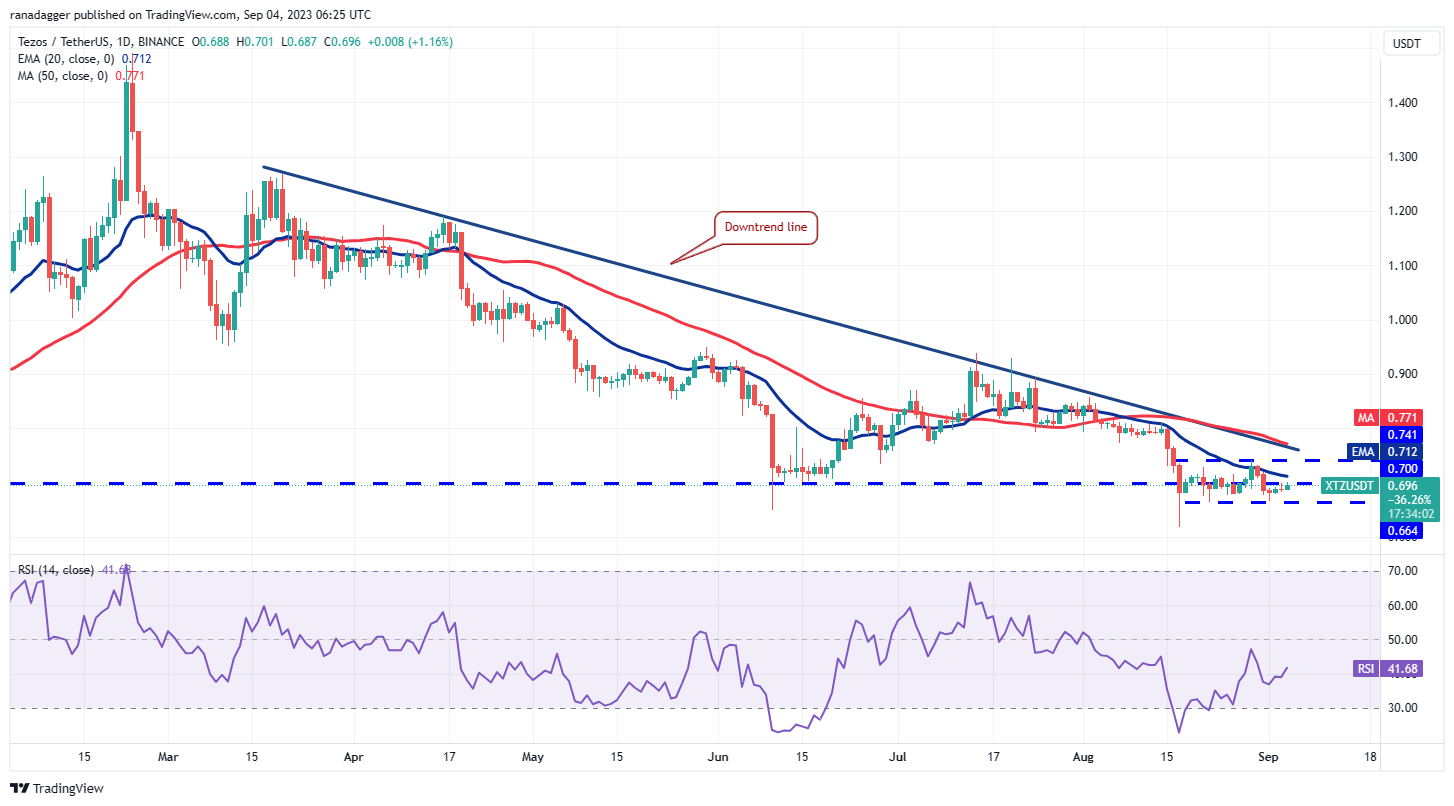
Tezos (XTZ $0.70) has witnessed a tussle between the bulls and the bears near the strong support at $0.70. The failure of the bears to sink and sustain the price below this level indicates buying at lower levels.
XTZ/USDT daily chart. Source: TradingView
The downsloping moving averages indicate an advantage to bears, but the rising RSI suggests that the bearish momentum is reducing. A close above the 20-day EMA ($0.71) will be the first sign of strength. That could pave the way for a rally to the downtrend line.
This level is likely to act as a formidable hurdle, but if the bulls overcome it, the XTZ/USDT pair may start a new up-move. The pair can first rally to $0.94 and subsequently to $1.04. This positive view will be invalidated if the price skids and sustains below $0.66.
XTZ/USDT 4-hour chart. Source: TradingView
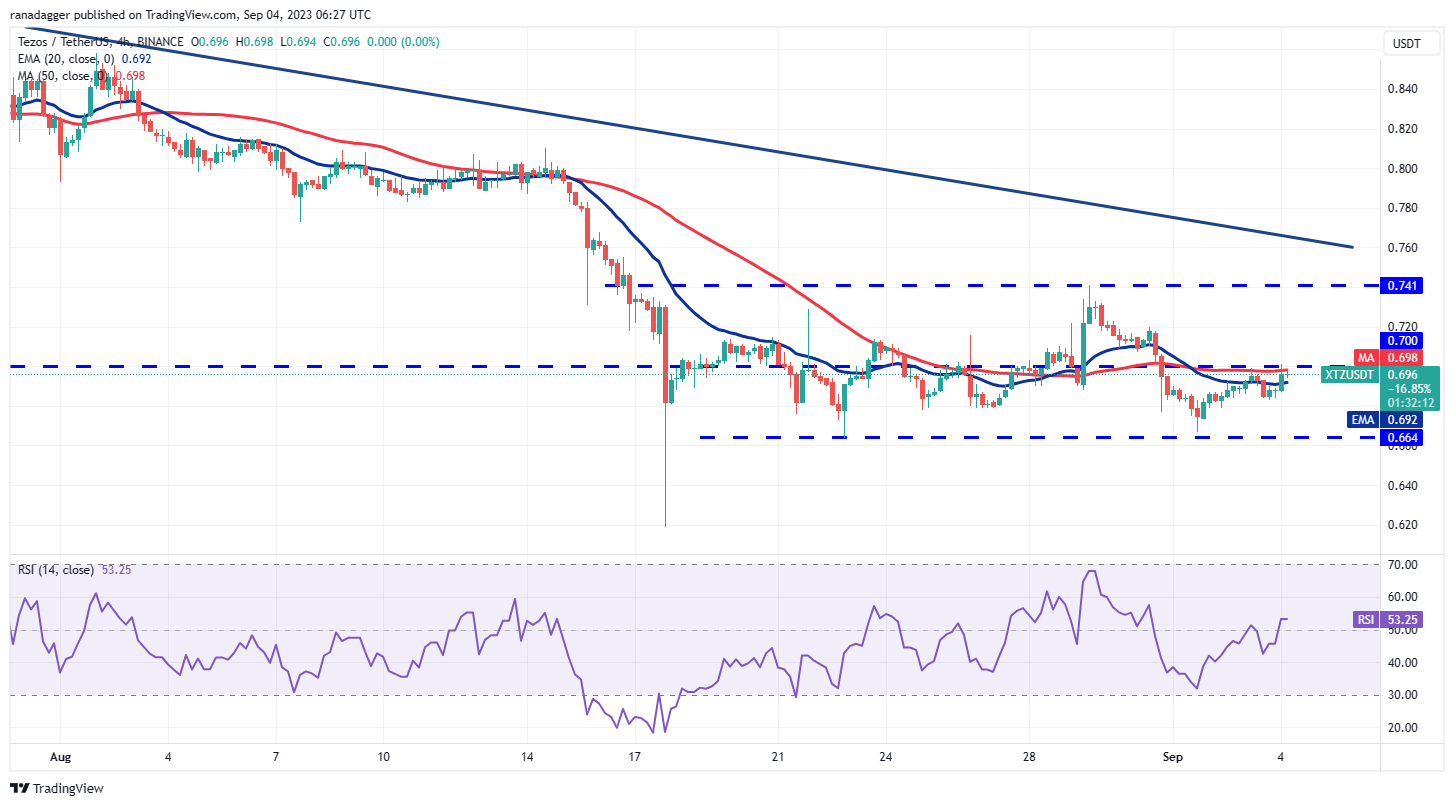
The 4-hour chart shows that the price is consolidating between $0.70 and $0.66. The crisscrossing moving averages and the RSI near the midpoint indicate a balance between supply and demand.
If the price rises above $0.70, the advantage will tilt in favor of the bulls. The pair could then surge to the overhead resistance at $0.74. The advantage will tilt in favor of the bears if they sink the price below $0.68. That is likely to result in a retest of the support at $0.66. If this level crumbles, the pair may start the next leg of the downtrend to $0.61.
Information on these pages contains forward-looking statements that involve risks and uncertainties. Markets and instruments profiled on this page are for informational purposes only and should not in any way come across as a recommendation to buy or sell in these assets. You should do your own thorough research before making any investment decisions. FXStreet does not in any way guarantee that this information is free from mistakes, errors, or material misstatements. It also does not guarantee that this information is of a timely nature. Investing in Open Markets involves a great deal of risk, including the loss of all or a portion of your investment, as well as emotional distress. All risks, losses and costs associated with investing, including total loss of principal, are your responsibility. The views and opinions expressed in this article are those of the authors and do not necessarily reflect the official policy or position of FXStreet nor its advertisers.
Recommended Content
Editors’ Picks

Top 3 Price Prediction Bitcoin, Ethereum, Ripple: BTC, ETH and XRP show signs of short-term correction
Bitcoin price edges slightly down during the Asian session on Wednesday. Ethereum and Ripple followed BTC’s footsteps and declined slightly; all coins’ technical indicators and price action suggest a possible short-term correction on the cards.

Ripple investors book $1.5 billion in profits after RLUSD launch, XRP struggles near $2.58 resistance
Ripple is up 3% on Wednesday after witnessing significant profit-taking among its investors following the launch of the RLUSD stablecoin. Whales have soaked up the selling pressure from profit-takers as XRP struggles near the $2.58 resistance level.

Alleged anti-crypto Caroline Crenshaw denied renomination vote to serve as SEC Commissioner
The Senate Banking Committee had scheduled a vote for Wednesday regarding the reappointment of Securities and Exchange Commission Commissioner Caroline Crenshaw, but this vote was canceled on Tuesday.

Ethereum Price Forecast: RWA tokenization could boost ETH's price in 2025, Bitwise
Ethereum is down 3% on Tuesday following Bitwise predictions of increased RWA tokenization boosting appeal for the top altcoin. Meanwhile, large whales have continued accumulating ETH in the past month.

Bitcoin: BTC reclaims $100K mark
Bitcoin briefly dipped below $94,000 earlier this week but recovered strongly, stabilizing around the $100,000 mark by Friday. Despite these mixed sentiments this week, institutional demand remained strong, adding $1.72 billion until Thursday.

Best Forex Brokers with Low Spreads
VERIFIED Low spreads are crucial for reducing trading costs. Explore top Forex brokers offering competitive spreads and high leverage. Compare options for EUR/USD, GBP/USD, USD/JPY, and Gold.
