Bitcoin few weeks away from its first weekly chart 'death cross'

Things could soon go from bad to worse for bitcoin (BTC) traders looking for bullish cues on technical charts.
The cryptocurrency's 50-week simple moving average (SMA) is falling fast and looks set to cross below the 200-week SMA for the first time on record.
According to technical analysis theory, the bearish intersection of the two averages often referred to as the death cross, means the market is about to head into a tailspin.
Bitcoin has dropped 75% since reaching a record high of $69,000 in November last year. The bear market has proved to be more intense than the previous ones during which sellers failed to establish a foothold under the 200-day SMA.
Critics of technical analysis would point out that the death cross, irrespective of whether it occurs on the daily or weekly charts, is a lagging indicator and unreliable. That's largely true, as the indicator is based on backward-looking moving averages and reflects the asset's past performance.
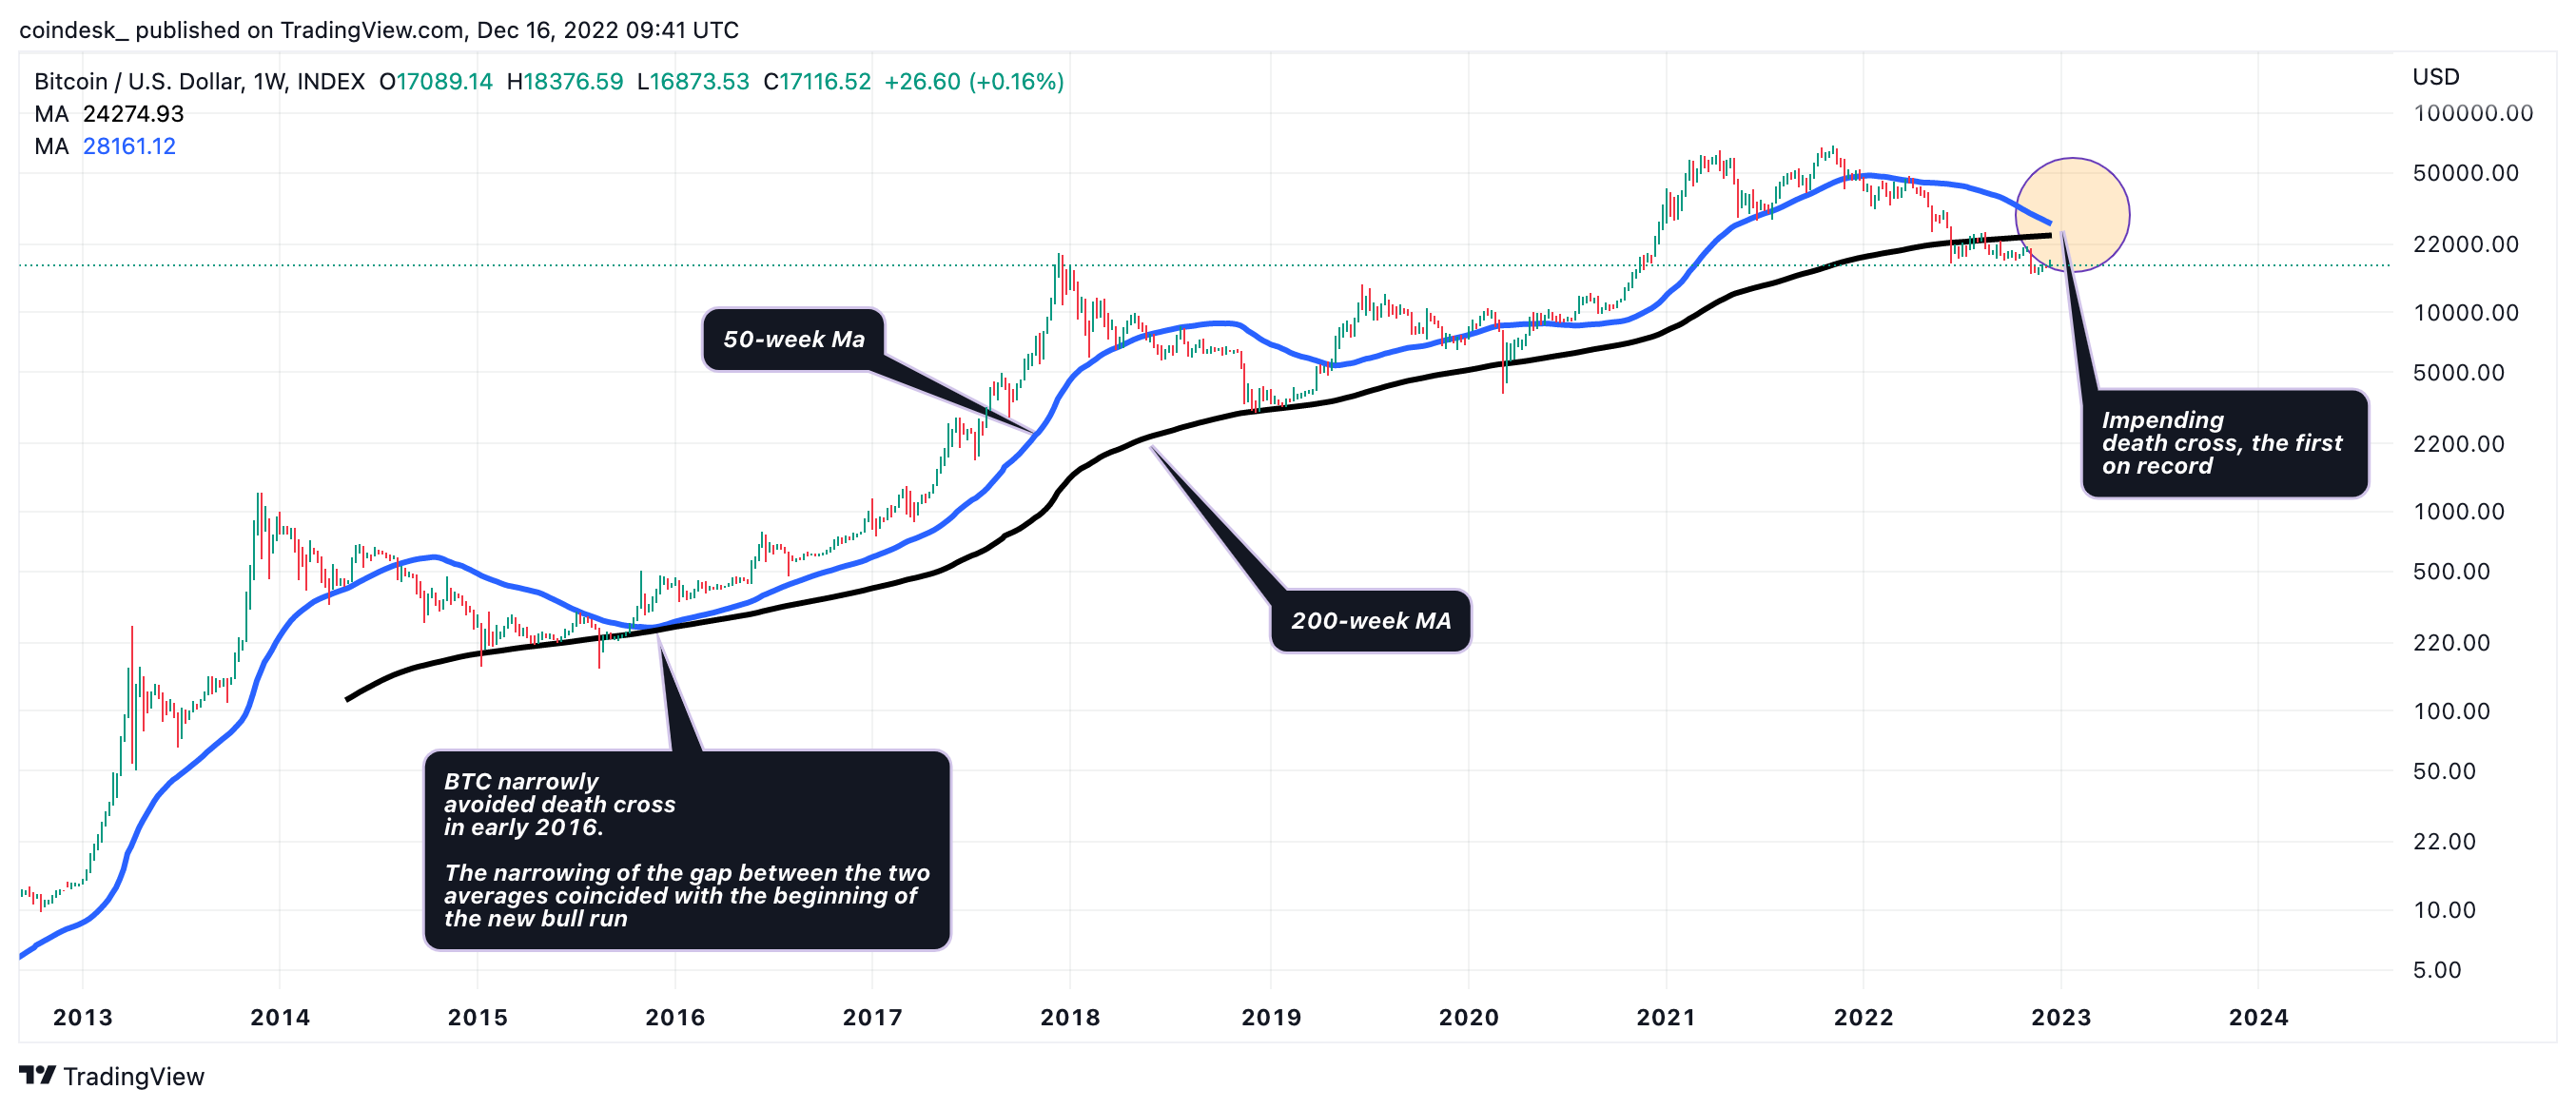
Bitcoin's weekly chart shows an impending death cross, the first in the cryptocurrency's 13 year history. (TradingView) (TradingView/CoinDesk)
Critics of technical analysis would point out that the death cross, irrespective of whether it occurs on the daily or weekly charts, is a lagging indicator and unreliable. That's largely true, as the indicator is based on backward-looking moving averages and reflects the asset's past performance.
The death cross has a bad reputation for trapping sellers on the wrong side of the market in traditional finance. And it has done so to bitcoin traders in the past. For instance, the daily chart death cross of March 2020 marked a major price bottom.
Seasoned traders, therefore, read the death cross in conjunction with other chart factors and fundamental indicators, which are split on the next possible move in bitcoin.
Per Delphi Digital, bitcoin's sideways trading in the range of $16,500 to $17,300 in the aftermath of FTX's collapse offers little hope to the bulls.
"We still believe this area does not have much structural support, and in the face of further contagion and uncertainty, we remain cautious as we watch the $9k-13k level," Delphi's strategists, led by Andrew Krohn, wrote in a note to clients.
Several miners or those responsible for minting coins are likely to go bankrupt in the first half of next year, pushing bitcoin to $12,000 and below. Add to that the Federal Reserve's persistent anti-stimulus bias and the path of least resistance appear to be on the downside.
That said, in the past, bitcoin has bottomed out to begin a new rally 15 months ahead of the mining reward halving, a programmed 50% reduction in the pace of supply expansion every four years.
The next bitcoin halving is due in March/April 2024. If history is a guide, the bitcoin bear market may have ended in November at $15,473 and the cryptocurrency could rally as high as $63,000 ahead of the halving.
Author

CoinDesk Analysis Team
CoinDesk
CoinDesk is the media platform for the next generation of investors exploring how cryptocurrencies and digital assets are contributing to the evolution of the global financial system.


