- Bitcoin price has dropped 12.7% since yesterday and shows no signs of stopping.
- Ethereum price follows the pioneer crypto’s lead and might retest $2,000 again.
- Unlike BTC or ETH, XRP price shows signs of recovery as long as it stays above a critical demand zone.
Bitcoin price has crashed twice within ten days, taking the entire cryptocurrency market into a tailspin. While some altcoins have recovered, BTC hints at an extension of this slump.
Bitcoin price eyes $45,000
Bitcoin price is hovering below the 100-day Simple Moving Average (SMA) at $49,365. The last time BTC closed below this level was on September 23, 2020. Therefore, a breakdown of this crucial barrier will trigger sellers to offload their holdings.
If such a scenario were to develop, Bitcoin price would head toward a significant support area that extends from $47,500 to $43,002.
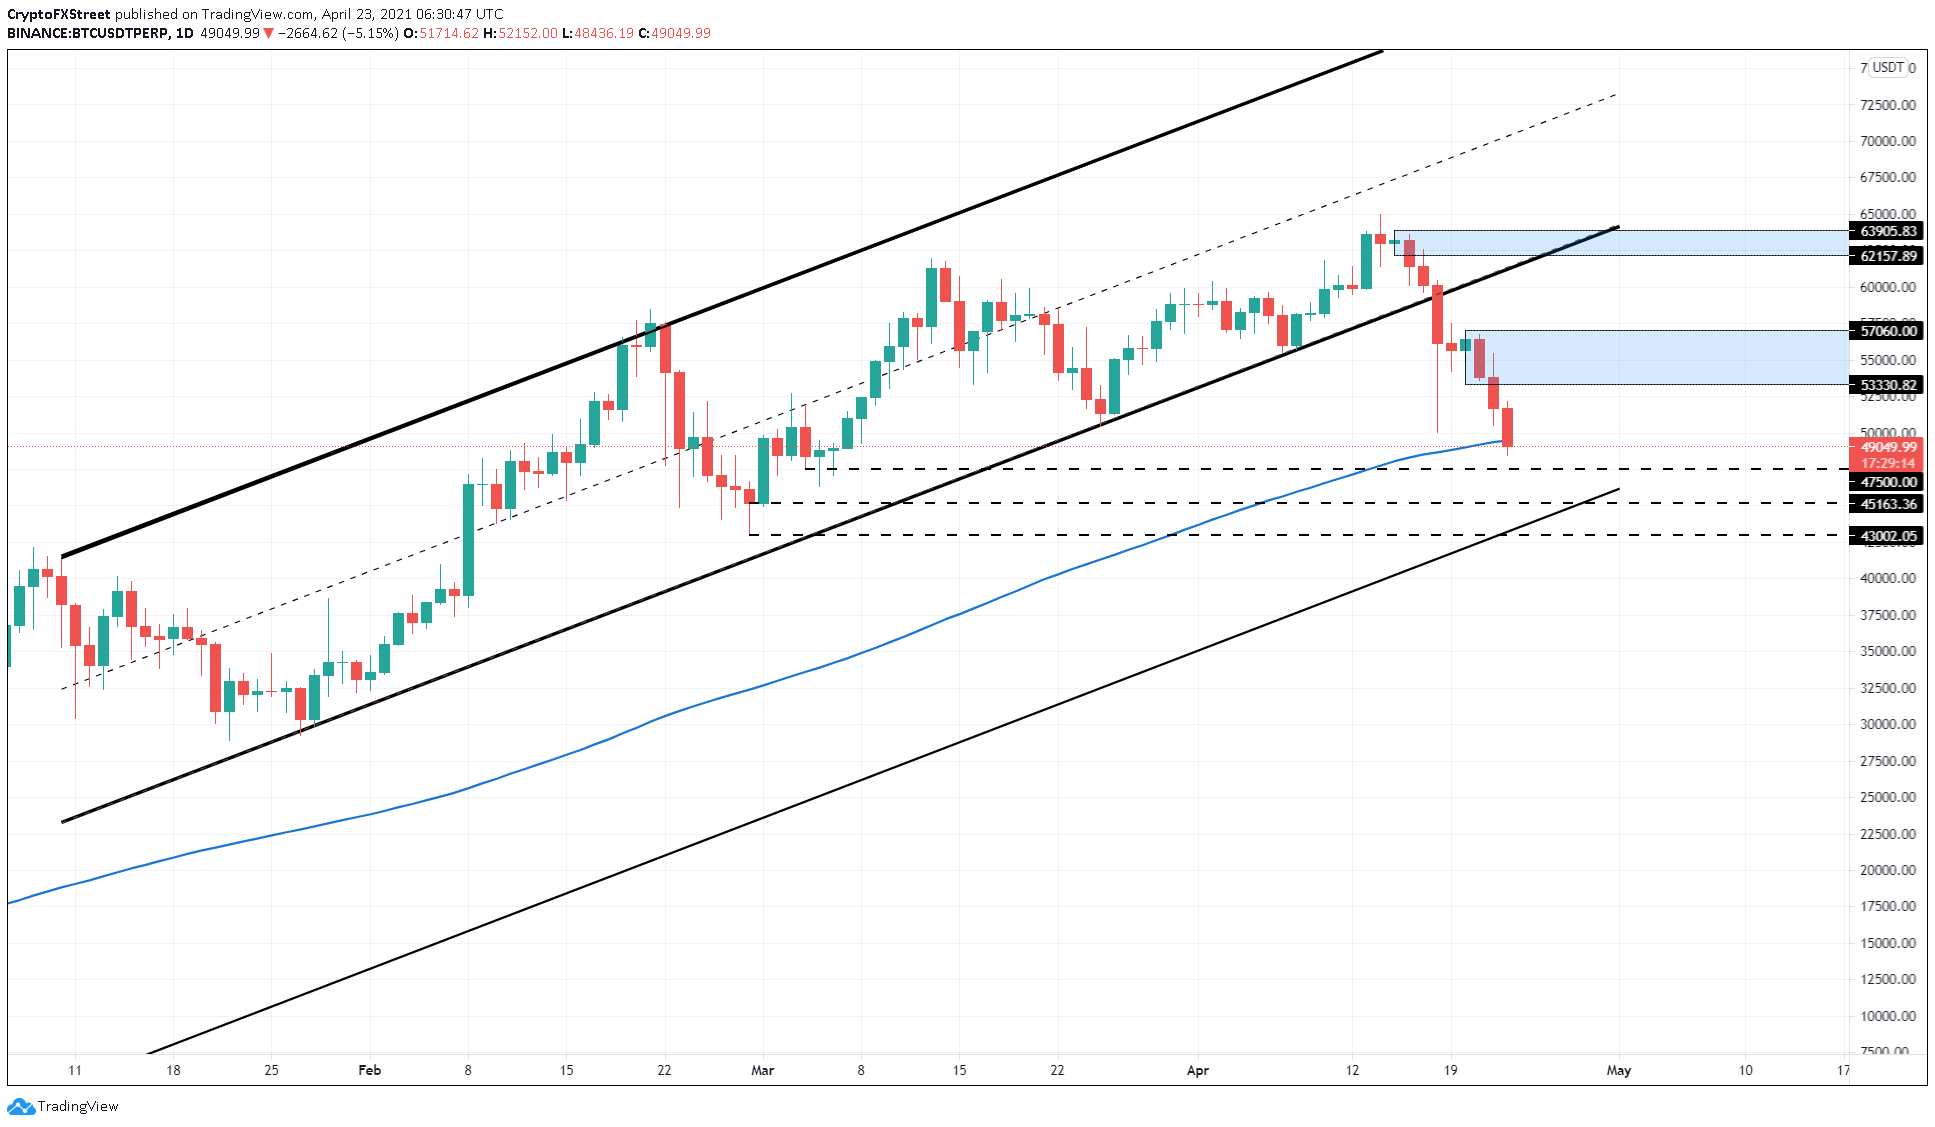
BTC/USDT 1-day chart
However, a bounce from the 100 SMA could push the flagship crypto toward the demand zone, stretching from $53,330 to $57,060.
Ethereum price looks to retest $2,000
Ethereum price is promptly following BTC’s lead and has undone almost all of yesterday’s gains. Now, ETH is trading at $2,200 and could slide another 5.5% to $2,000.
The SuperTrend indicator’s recently spawned sell signal supports this downtrend.
Under dire circumstances, the pioneer altcoin could retest the 200 four-hour SMA at $2,038.
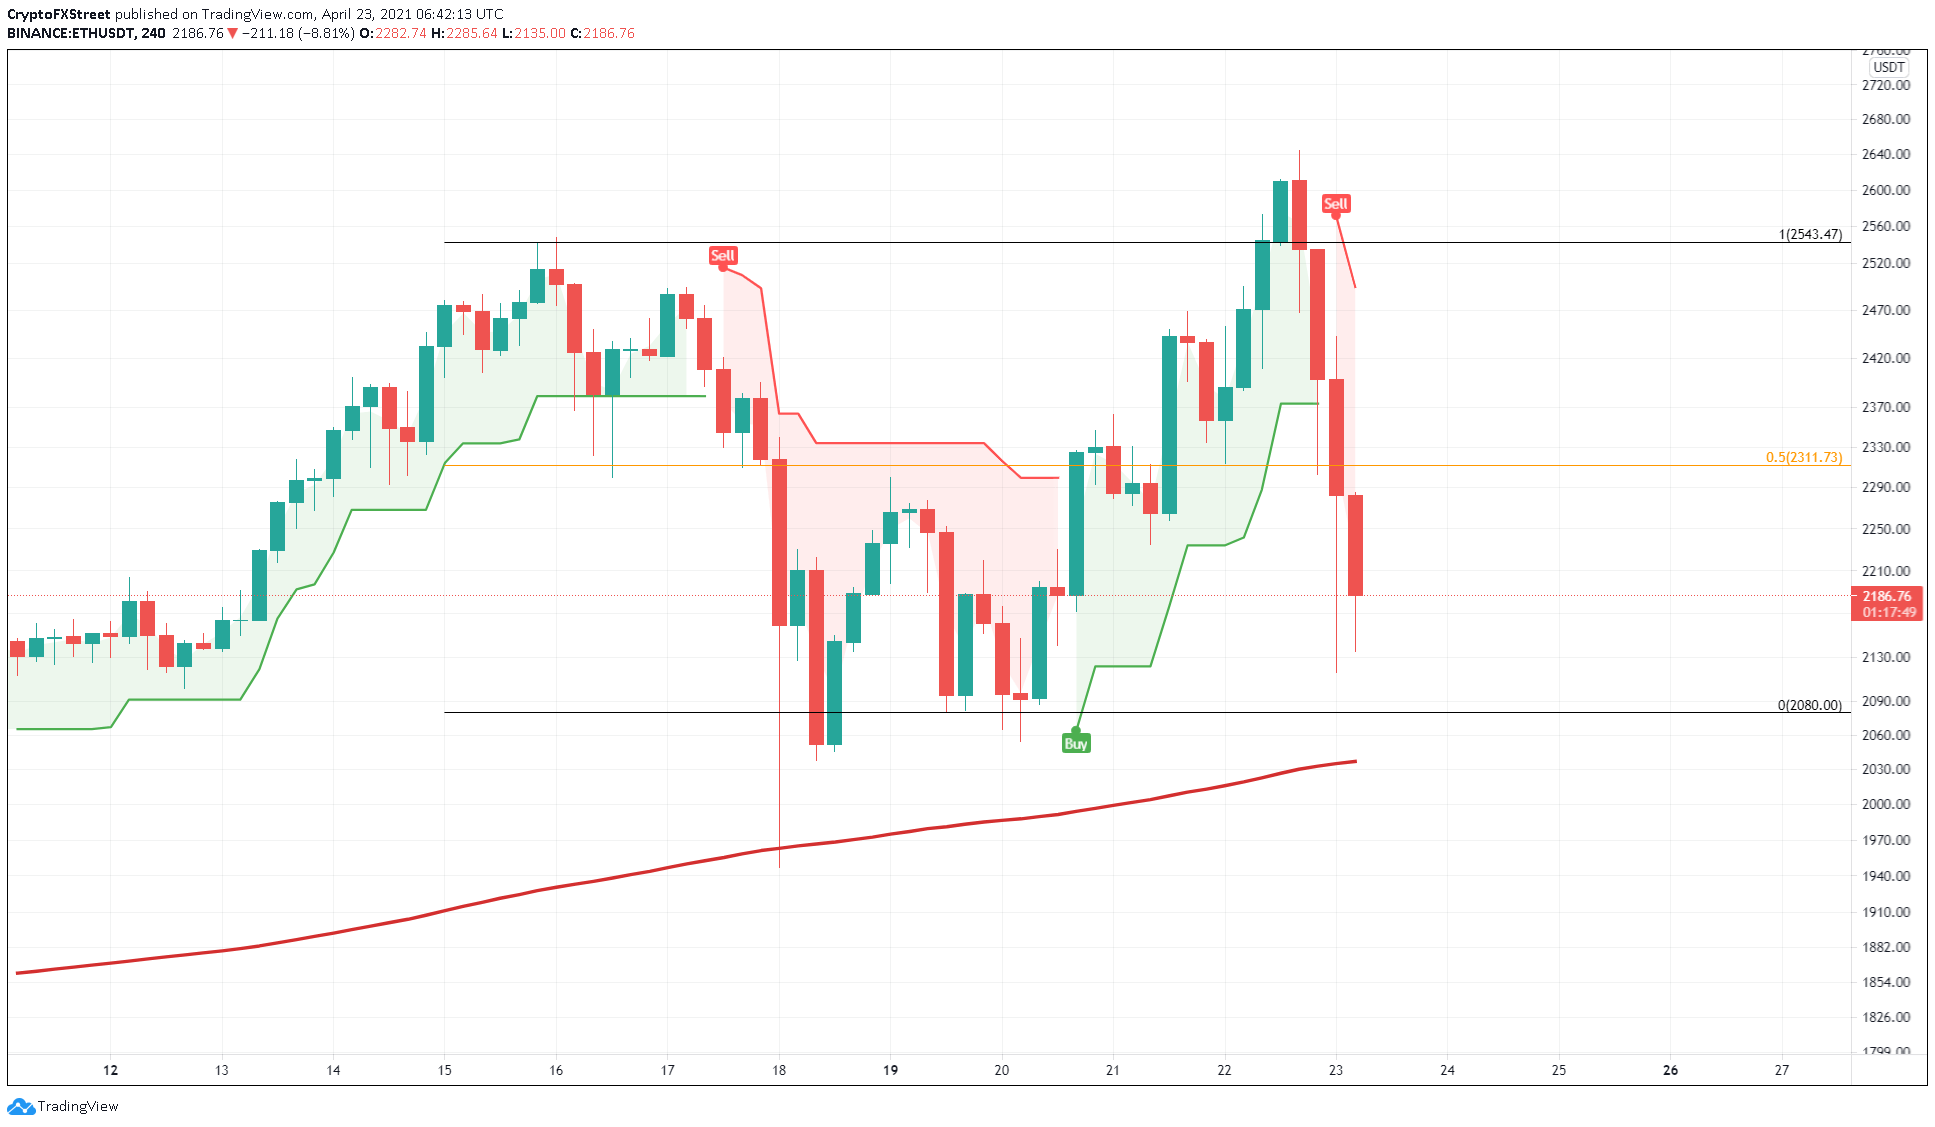
ETH/USDT 4-hour chart
Regardless of the bearish pressure, buyers might rescue Ethereum price around the psychological level of $2,000. If the bid orders keep rising here, ETH could head to retest the 50% Fibonacci retracement level at $2,311.
XRP price may have started its recovery
XRP price has sliced through the 50 SMA and is testing the 200 SMA on the four-hour chart. Interestingly, the demand barrier’s upper boundary at $0.977 coincides with the 200 SMA. Moreover, XRP investors show extreme resilience in this area as they have scooped up a previous spike below this level.
Hence, a bounce seems likely.
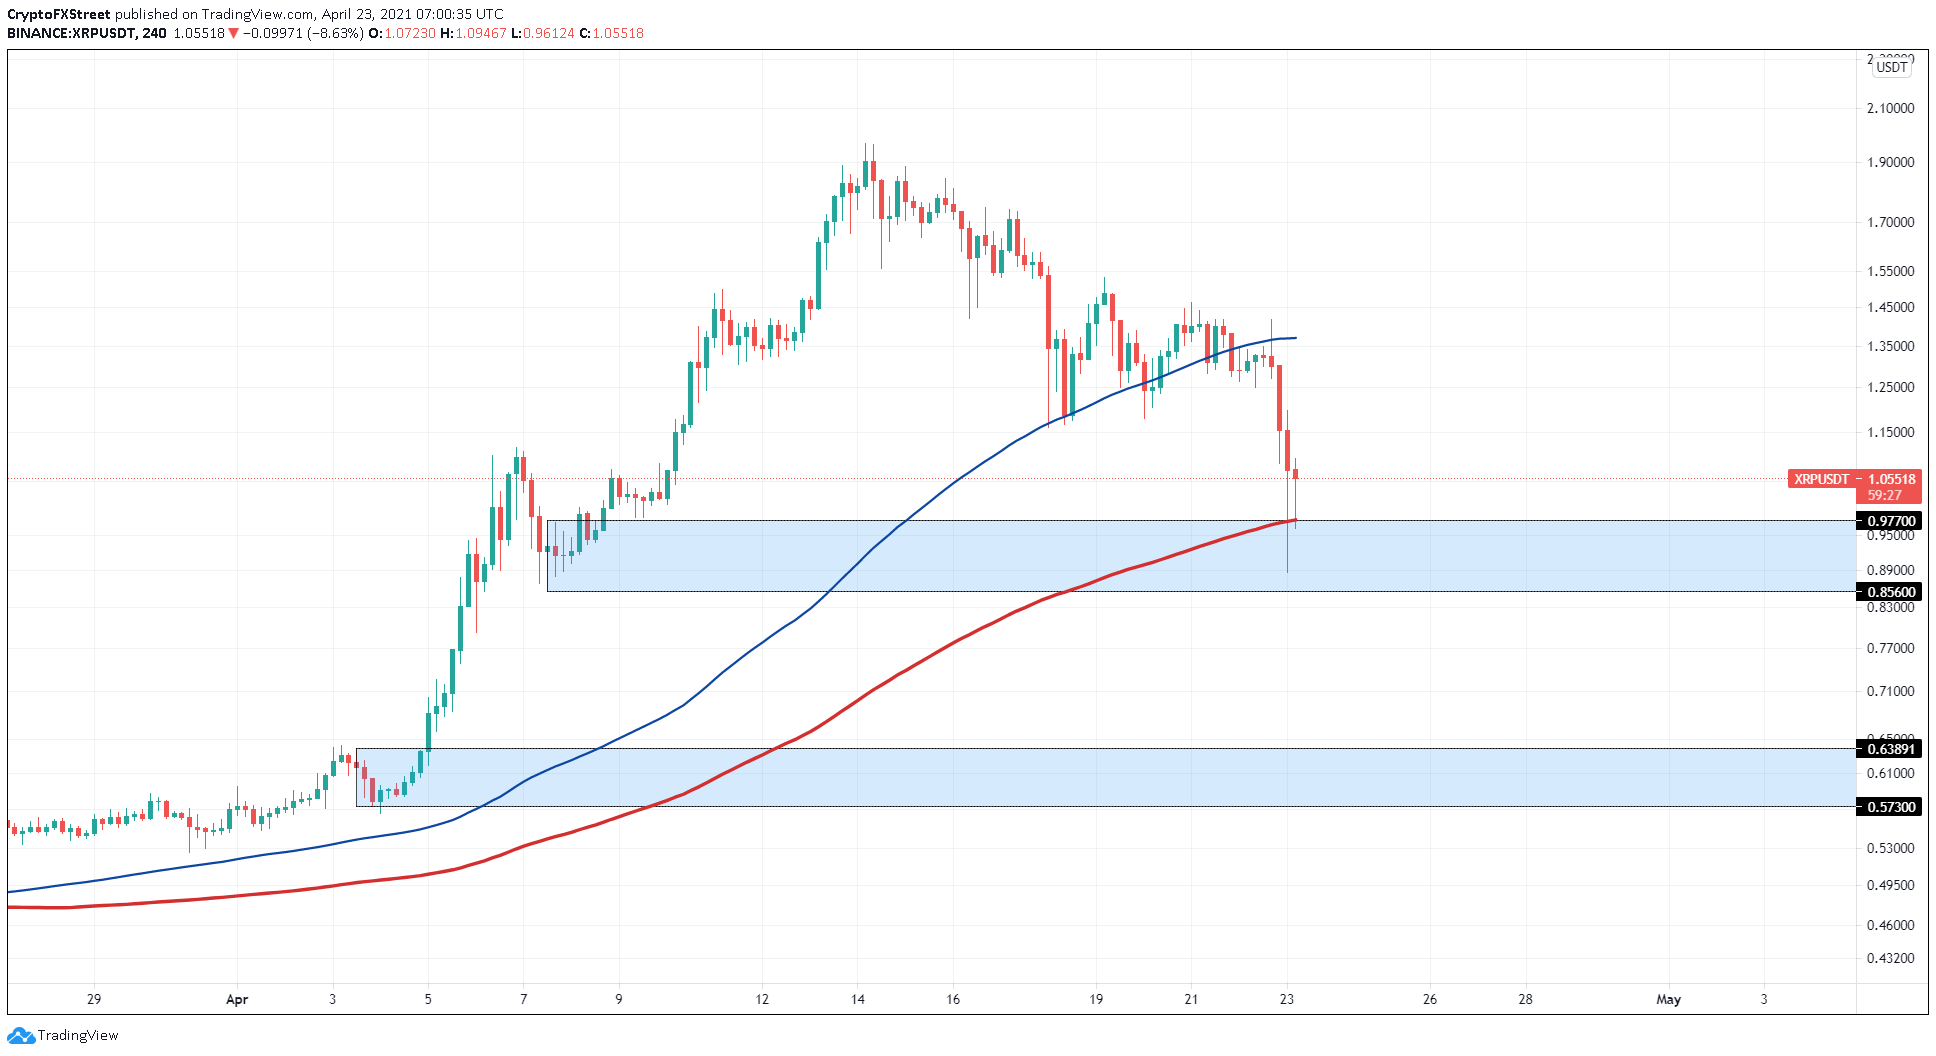
XRP/USDT 4-hour chart
Considering the bearish nature of the entire cryptocurrency market, it wouldn’t be surprising if the said area of demand is breached. In such a case, market participants can expect the remittance token to head to the subsequent support zone that ranges from $0.573 to $0.638.
Information on these pages contains forward-looking statements that involve risks and uncertainties. Markets and instruments profiled on this page are for informational purposes only and should not in any way come across as a recommendation to buy or sell in these assets. You should do your own thorough research before making any investment decisions. FXStreet does not in any way guarantee that this information is free from mistakes, errors, or material misstatements. It also does not guarantee that this information is of a timely nature. Investing in Open Markets involves a great deal of risk, including the loss of all or a portion of your investment, as well as emotional distress. All risks, losses and costs associated with investing, including total loss of principal, are your responsibility. The views and opinions expressed in this article are those of the authors and do not necessarily reflect the official policy or position of FXStreet nor its advertisers. The author will not be held responsible for information that is found at the end of links posted on this page.
If not otherwise explicitly mentioned in the body of the article, at the time of writing, the author has no position in any stock mentioned in this article and no business relationship with any company mentioned. The author has not received compensation for writing this article, other than from FXStreet.
FXStreet and the author do not provide personalized recommendations. The author makes no representations as to the accuracy, completeness, or suitability of this information. FXStreet and the author will not be liable for any errors, omissions or any losses, injuries or damages arising from this information and its display or use. Errors and omissions excepted.
The author and FXStreet are not registered investment advisors and nothing in this article is intended to be investment advice.
Recommended Content
Editors’ Picks

XRP chart signals 27% jump after SEC-Ripple appeals pause and $50 million settlement
Ripple (XRP) stabilized above $2.00 exemplifying a similar pattern to the largest cryptocurrency by market capitalization, Bitcoin (BTC), which holds firmly above $84,000 at the time of writing on Thursday.

Bitwise lists four crypto ETPs on London Stock Exchange
Bitwise announced on Wednesday that it had listed four of its Germany-issued crypto Exchange-Traded products (ETPs) on the London Stock Exchange. It aims to expand access to its products for Bitcoin (BTC) and Ethereum (ETH) investors and widen its footprint across European markets.

RAY sees double-digit gains as Raydium unveils new Pumpfun competitor
RAY surged 10% on Wednesday as Raydium revealed its new meme coin launchpad, LaunchLab, a potential competitor to Pump.fun — which also recently unveiled its decentralized exchange (DEX) PumpSwap.

Ethereum Price Forecast: ETH face value- accrual risks due to data availability roadmap
Ethereum (ETH) declined 1%, trading just below $1,600 in the early Asian session on Thursday, as Binance Research's latest report suggests that the data availability roadmap has been hampering its value accrual.

Bitcoin Weekly Forecast: Market uncertainty lingers, Trump’s 90-day tariff pause sparks modest recovery
Bitcoin (BTC) price extends recovery to around $82,500 on Friday after dumping to a new year-to-date low of $74,508 to start the week. Market uncertainty remains high, leading to a massive shakeout, with total liquidations hitting $2.18 billion across crypto markets.

The Best brokers to trade EUR/USD
SPONSORED Discover the top brokers for trading EUR/USD in 2025. Our list features brokers with competitive spreads, fast execution, and powerful platforms. Whether you're a beginner or an expert, find the right partner to navigate the dynamic Forex market.