-
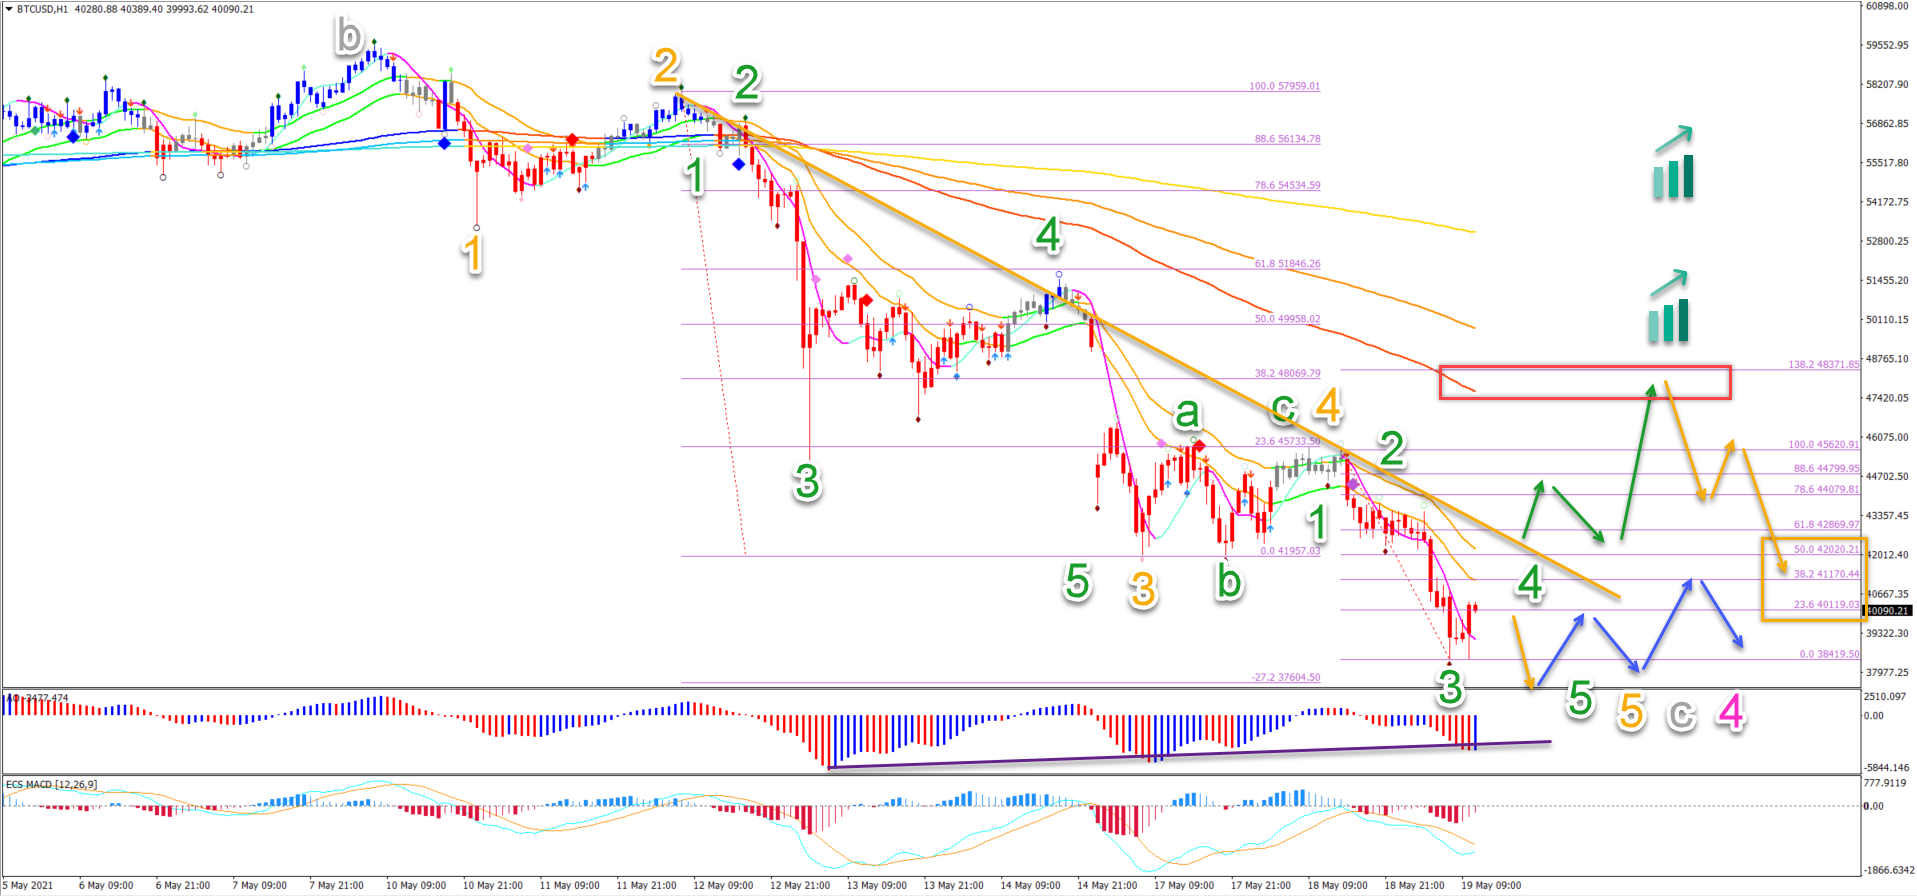
Bitcoin (BTC/USD) made a bearish breakout and one more lower low as expected. But the BTC/USD did not make a bullish bounce at the 38.2% Fibonacci level.
-
On the 1 hour chart, price action is building lower lows as part of the wave C (grey). The bullish price action are wave 4 pullbacks.
-
The main target of the bearish price action is the 50% Fibonacci support zone around $37,500.
Instead, price action broke below the Fib and is now approaching the 50% Fib level. What can be expected next for Bitcoin?

Price charts and technical analysis
The BTC/USD decline is stronger then previously expected due to the break below the 38.2% Fibonacci level. This could be a first warning signal that price action might be a deep correction:
-
If the wave analysis is correct, price action is still in a wave 4 (pink) as previously mentioned.
-
This is valid as long as price action remains above the 50% Fibonacci level near $37,500. Two other aspects help the support zone: the 21 emas and the sideways zone (green box).
-
A break below 50% Fibonacci level and every Fib below it however is a warning signal (orange circles) that the wave 4 (pink) outlook might be incorrect.
-
A break below the 88.6% Fib invalidates the wave 4 (red circle).
-
If the wave 4 pattern (pink) is correct, then there are 2 main scenarios for a recovery. The first one is indicated by the green arrows: a strong bullish rebound.
-
The second scenario is price action will slowly respond to the support zone. This is indicated by the orange arrows. This is a phase where price action carefully turns up with many dips to test the support zone before moving up later on (blue arrow). This is the most likely scenario at the moment due to the strong bearish price action.
-
If our wave analysis is correct, then the wave 4 (pink) could be lengthy but eventually, a new uptrend could send it higher within a wave 3 (purple) of wave 3 (red).
On the 1 hour chart, price action is building lower lows as part of the wave C (grey). The bullish price action are wave 4 pullbacks:
-
The current pullback could also be a wave 4 (green) of a lower degree.
-
A bearish bounce at the Fibonacci levels could indicate at least one more lower low.
-
The main target of the bearish price action is the 50% Fibonacci support zone around $37,500.
-
A bullish bounce could occur at the target (blue arrows).
-
A break (green arrows) above the 50-61.8% Fibonacci however could indicate the end of the 1 hour downtrend.
-
The main target of a bullish break is the resistance zone (red box), which could create a bearish bounce (orange arrows).
The analysis has been done with the ecs.SWAT method and ebook.
Elite CurrenSea Training Program(s) should not be treated as a recommendation or a suggestion to buy or sell any security or the suitability of any investment strategy for Student. The purchase, sale, or advice regarding any security, other financial instrument or system can only be performed by a licensed Industry representative; such as, but not limited to a Broker/Dealer, Introducing Broker, FCM and/or Registered Investment Advisor. Neither Elite CurrenSea nor its representatives are licensed to make such advisements. Electronic active trading (trading) may put your capital at risk, hence all trading decisions are made at your own risk. Furthermore, trading may also involve a high volume & frequency of trading activity. Each trade generates a commission and the total daily commission on such a high volume of trading can be considerable. Trading accounts should be considered speculative in nature with the objective being to generate short-term profits. This activity may result in the loss of more than 100% of an investment, which is the sole responsibility of the client. Any trader should realise the operation of a margin account under various market conditions and review his or her investment objectives, financial resources and risk tolerances to determine whether margin trading is appropriate for them. The increased leverage which margin provides may heighten risk substantially, including the risk of loss in excess of 100% of an investment.
Recommended Content
Editors’ Picks

Cardano stabilizes near $0.62 after Trump’s 90-day tariff pause-led surge
Cardano stabilizes around $0.62 on Thursday after a sharp recovery the previous day, triggered by US Donald Trump’s decision to pause tariffs for 90 days except for China and other countries that had retaliated against the reciprocal tariffs announced on April 2.

Solana signals bullish breakout as Huma Finance 2.0 launches on the network
Solana retests falling wedge pattern resistance as a 30% breakout looms. Huma Finance 2.0 joins the Solana DeFi ecosystem, allowing access to stable, real yield. A neutral RSI and macroeconomic uncertainty due to US President Donald Trump’s tariff policy could limit SOL’s rebound.

Bitcoin stabilizes around $82,000, Dead-Cat bounce or trendline breakout
Bitcoin (BTC) price stabilizes at around $82,000 on Thursday after recovering 8.25% the previous day. US President Donald Trump's announcement of a 90-day tariff pause on Wednesday triggered a sharp recovery in the crypto market.

Top 3 gainers Flare, Ondo and Bittensor: Will altcoins outperform Bitcoin after Trump's tariff pause?
Altcoins led by Flare, Ondo and Bittensor surge on Thursday as markets welcome President Trump's tariff pause. Bitcoin rally falters as traders quickly book profits amid Trump's constantly changing tariff policy.

Bitcoin Weekly Forecast: Tariff ‘Liberation Day’ sparks liquidation in crypto market
Bitcoin (BTC) price remains under selling pressure and trades near $84,000 when writing on Friday after a rejection from a key resistance level earlier this week.

The Best brokers to trade EUR/USD
SPONSORED Discover the top brokers for trading EUR/USD in 2025. Our list features brokers with competitive spreads, fast execution, and powerful platforms. Whether you're a beginner or an expert, find the right partner to navigate the dynamic Forex market.