Bitcoin Cash Technical Analysis: BCH/USD price consolidating in a flag formation

BCH/USD Daily Chart
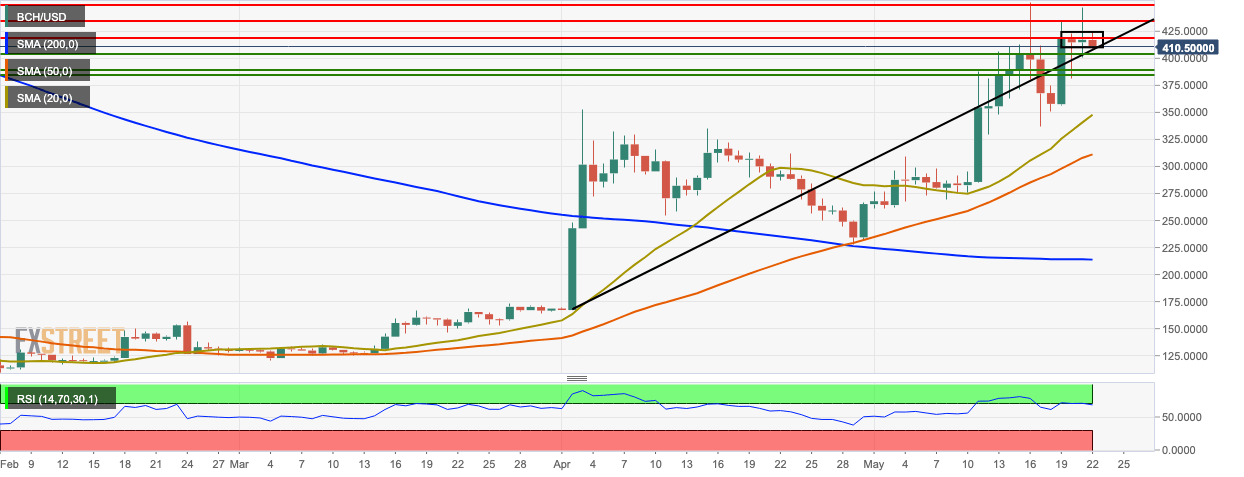
- BCH/USD went down from $416.25 to $411 this Wednesday.
- The price is currently consolidating in a flag formation.
- On the downside, the nearest support level lies at $405.
- The market is trending above the SMA 200, SMA 50, and SMA 20 curves.
- The price is creeping on the edge of the overbought zone.
BCH/USD 4-Hour Chart
-636940959772981554.png)
- The extreme squeeze of the 20-day Bollinger band shows decreasing market volatility.
- The last session of the 4-hour market has dropped into the lower half of the 20-day Bollinger band.
- The moving average convergence/divergence (MACD) indicator shows that market momentum has now become bearish.
BCH/USD Hourly Chart
-636940959178592689.png)
- The Elliot wave oscillator shows seven consecutive bearish sessions.
- The hourly price is currently trending in a downward channel formation.
- The Ichimoku indicator shows that current and future market sentiment is bearish.
Key Levels
Author

Rajarshi Mitra
Independent Analyst
Rajarshi entered the blockchain space in 2016. He is a blockchain researcher who has worked for Blockgeeks and has done research work for several ICOs. He gets regularly invited to give talks on the blockchain technology and cryptocurrencies.
More from Rajarshi Mitra


