- Bitcoin Cash breaks out of a parallel descending channel but hits pause slightly above $240.
- BCH/USD is expected to resume the uptrend to $260, as highlighted by on-chain analysis.
The cryptocurrency market squeeze finally reached its elastic limit over the weekend. Trading yielded for most of the digital assets led by the flagship cryptocurrency, Bitcoin. Bitcoin Cash (BCH) built an uptrend on the support established at $220. The price action extended marginally above $240 before the breakout stalled. BCH/USD is trading at $239 at the time of writing, following a minor retreat.
Bitcoin Cash retreat in the offing
The 50-day Simple Moving Average (SMA) providing initial support. Besides, the hurdle at $240, the 200-day SMA limits upside action, delaying the much-anticipated breakout to $260. Despite the spike above a descending channel, BCH bulls appear to have lost the steam. According to the Relative Strength Index (RSI), the barrier at $240 seems temporary because the bullish price action is expected to continue in the near term.
BCH/USD daily chart
-637380718949538631.png)
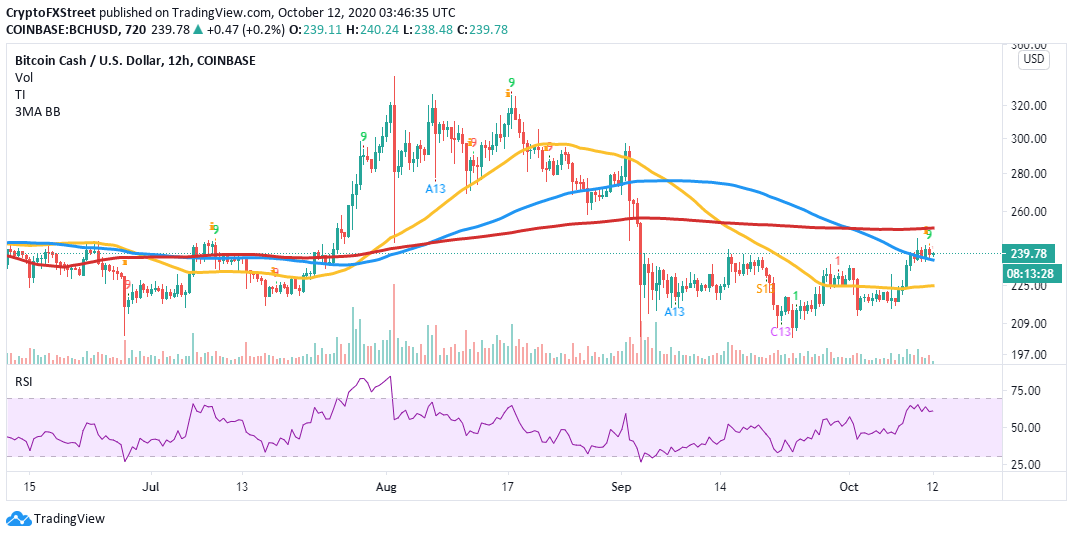
The TD Sequential indicator presents a sell signal in the form of a green nine candlestick in the 12-hour timeframe. In other words, BCH/USD could embark on a spiral, mostly if the 100 Simple Moving Average support is shattered. The next rendezvous will be $225, support established by the 50 SMA. The sell signal could be invalidated if BCH holds above the 100 SMA and reclaims the ground beyond $240.
BCH/USD 12-hour chart
IntoTheBlock’s IOMAP model reveals the presence of minor resistance towards $260. However, outlook will gain more credence if the seller congestion in the range between $243 and $250 is brought down. Here, 48,800 addresses previously purchased 545,000 BCH. Note that price action past $260 will encounter other minor hurdles.
BCH IOMAP chart
-637380719636564901.png)
On the downside, Bitcoin Cash is holding above areas of immense support. It is doubtful that BCH will resume the downtrend, as highlighted by the model. The most robust support lies between $227 and $233. Here, 112,000 addresses previously purchased 1.3 million BCH.
Looking at the other side of the fence
It is worth mentioning that Bitcoin Cash could resume the downtrend sabotaging the expected gains towards $260. The TD Sequential indicator flashed a sell signal on the 12-hour chart, awaiting validation by a break below the 100 SMA. Declines below the 100 SMA could test support at $225, as highlighted by the 50 SMA. Simultaneously the RSI in the 12-hour range supports the bearish outlook following a rejection at 65.
Information on these pages contains forward-looking statements that involve risks and uncertainties. Markets and instruments profiled on this page are for informational purposes only and should not in any way come across as a recommendation to buy or sell in these assets. You should do your own thorough research before making any investment decisions. FXStreet does not in any way guarantee that this information is free from mistakes, errors, or material misstatements. It also does not guarantee that this information is of a timely nature. Investing in Open Markets involves a great deal of risk, including the loss of all or a portion of your investment, as well as emotional distress. All risks, losses and costs associated with investing, including total loss of principal, are your responsibility. The views and opinions expressed in this article are those of the authors and do not necessarily reflect the official policy or position of FXStreet nor its advertisers. The author will not be held responsible for information that is found at the end of links posted on this page.
If not otherwise explicitly mentioned in the body of the article, at the time of writing, the author has no position in any stock mentioned in this article and no business relationship with any company mentioned. The author has not received compensation for writing this article, other than from FXStreet.
FXStreet and the author do not provide personalized recommendations. The author makes no representations as to the accuracy, completeness, or suitability of this information. FXStreet and the author will not be liable for any errors, omissions or any losses, injuries or damages arising from this information and its display or use. Errors and omissions excepted.
The author and FXStreet are not registered investment advisors and nothing in this article is intended to be investment advice.
Recommended Content
Editors’ Picks

Bitcoin Weekly Forecast: BTC nosedives below $95,000 as spot ETFs record highest daily outflow since launch
Bitcoin price continues to edge down, trading below $95,000 on Friday after declining more than 9% this week. Bitcoin US spot ETFs recorded the highest single-day outflow on Thursday since their launch in January.

Bitcoin crashes to $96,000, altcoins bleed: Top trades for sidelined buyers
Bitcoin (BTC) slipped under the $100,000 milestone and touched the $96,000 level briefly on Friday, a sharp decline that has also hit hard prices of other altcoins and particularly meme coins.

Solana Price Forecast: SOL’s technical outlook and on-chain metrics hint at a double-digit correction
Solana (SOL) price trades in red below $194 on Friday after declining more than 13% this week. The recent downturn has led to $38 million in total liquidations, with over $33 million coming from long positions.

SEC approves Hashdex and Franklin Templeton's combined Bitcoin and Ethereum crypto index ETFs
The SEC approved Hashdex's proposal for a crypto index ETF. The ETF currently features Bitcoin and Ethereum, with possible additions in the future. The agency also approved Franklin Templeton's amendment to its Cboe BZX for a crypto index ETF.

Bitcoin: 2025 outlook brightens on expectations of US pro-crypto policy
Bitcoin (BTC) price has surged more than 140% in 2024, reaching the $100K milestone in early December. The rally was driven by the launch of Bitcoin Spot Exchange Traded Funds (ETFs) in January and the reduced supply following the fourth halving event in April.

Best Forex Brokers with Low Spreads
VERIFIED Low spreads are crucial for reducing trading costs. Explore top Forex brokers offering competitive spreads and high leverage. Compare options for EUR/USD, GBP/USD, USD/JPY, and Gold.