Bitcoin Cash Price Analysis: BCH/USD another drop is looming
- Bitcoin Cash price is trading in the red, with losses of 2.30% in the second half of the session.
- BCH/USD is running at three steep consecutive sessions in the red, as bears regain momentum.
- A big barrier at the psychological $500 price mark promoted sellers to come back into play.

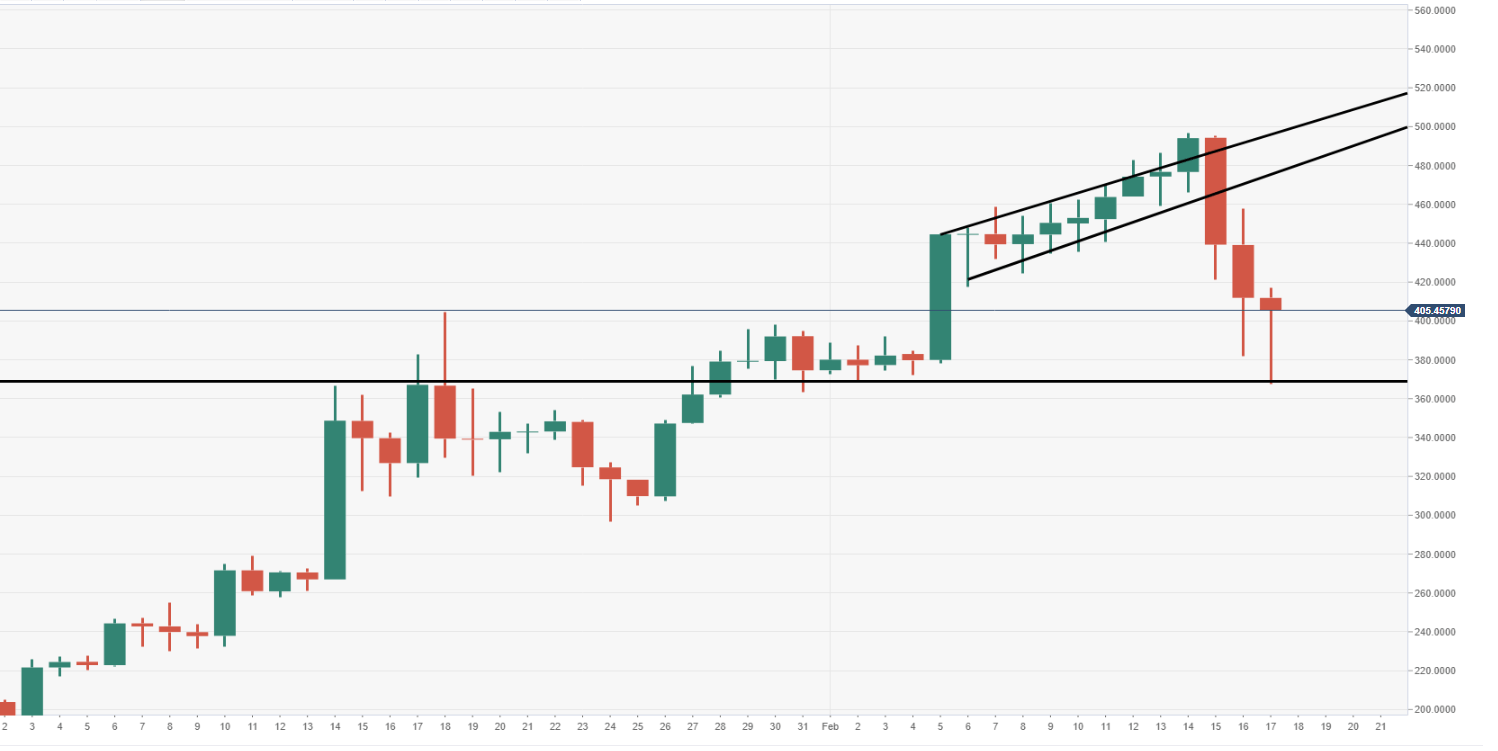
BCH/USD daily chart
The price smashed out to the downside from a rising channel structure, support has caught the price at around the session low $370 (daily support).
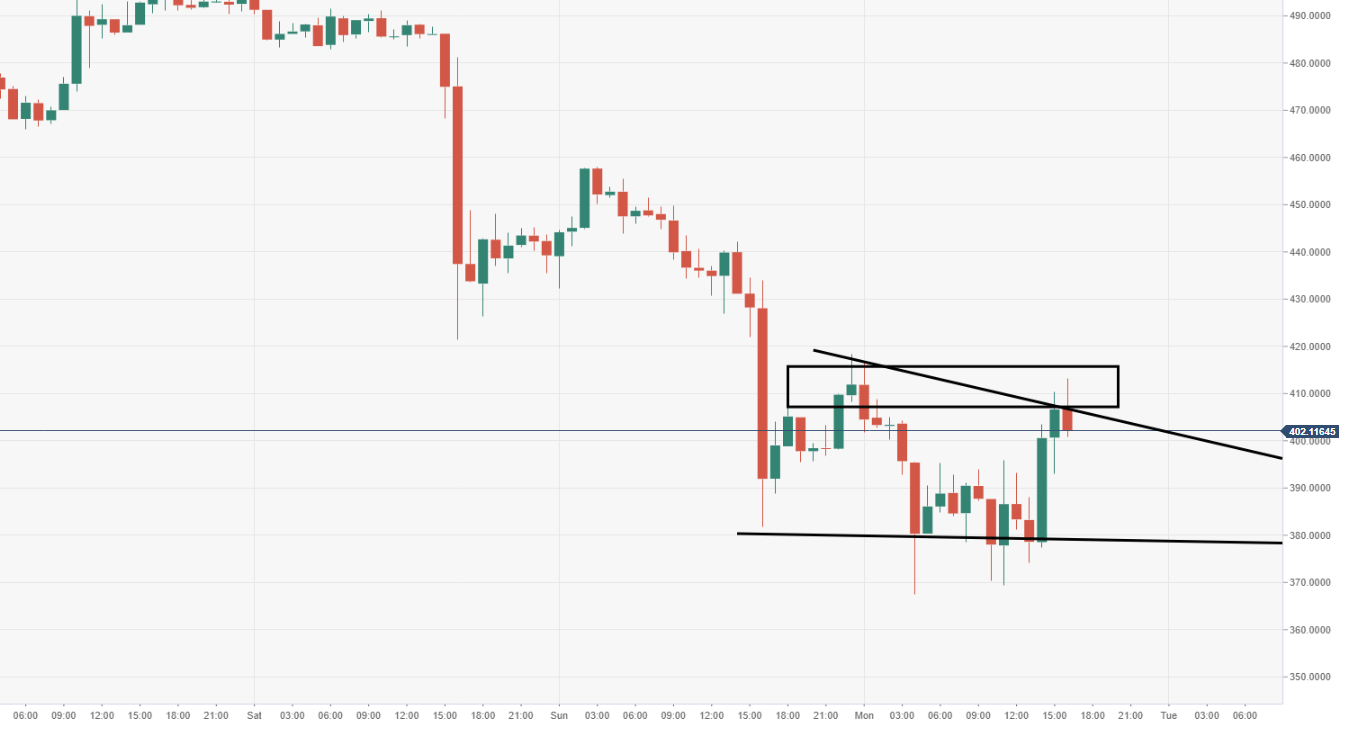
BCH/USD 60-minute chart
A near-term double top can be observed via the 60-minute chart view, with price action also moving within a pennant structure.
Spot rate: 404.15
Relative change: -2.30%
High: 416.86
Low: 367.58
Author

Ken Chigbo
Independent Analyst
Ken has over 8 years exposure to the financial markets. He started his career as an analyst, covering a variety of asset classes; forex, fixed income, commodities and equities.
More from Ken Chigbo


