![]() Rajarshi Mitra
Rajarshi Mitra
Independent Analyst
- The parabolic SAR has reversed from bullish to bearish in the 4-hour chart.
- The IOMAP shows that the price is currently sitting on top of a healthy support wall.
The BCH 4-hour chart flashed a sell sign in the TD sequential indicator. After flashing the signal, the price has been trending horizontally over the next six sessions.
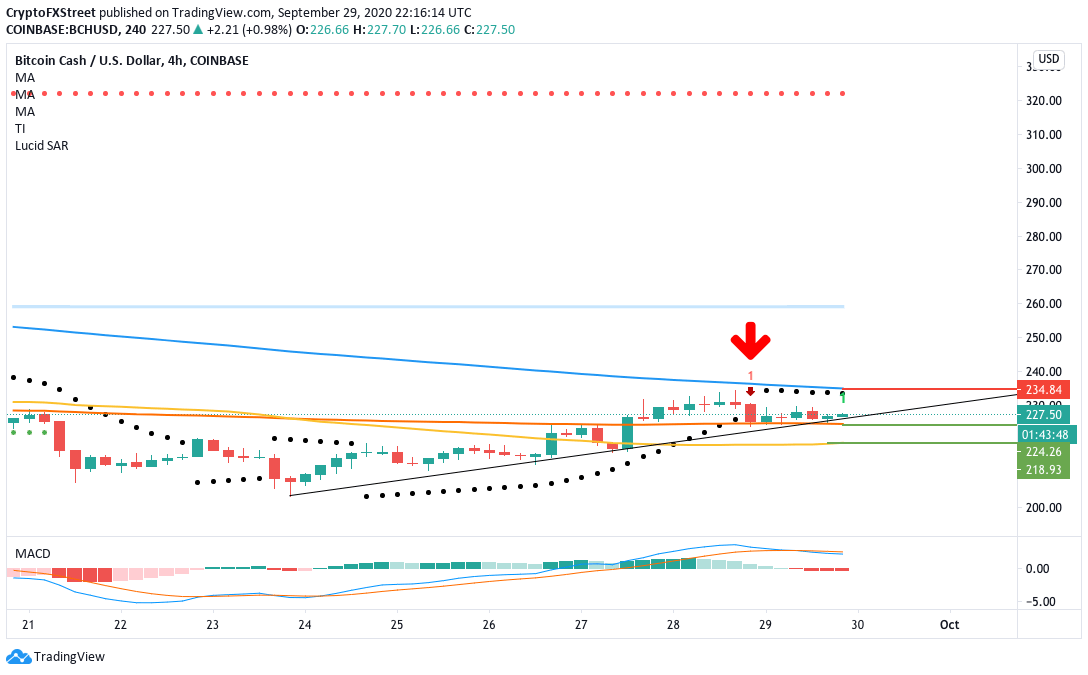
BCH needs to break below the upward trending line and the SMA 200 ($224.25) to validate that sell signal and strengthen the downtrend. The parabolic SAR and MACD are both bearish, which shows that the price should ideally break below this period of consolidation. However, why is the price consolidating in the first place instead of going down? For that, we need to look at the IOMAP.
BCH IOMAP
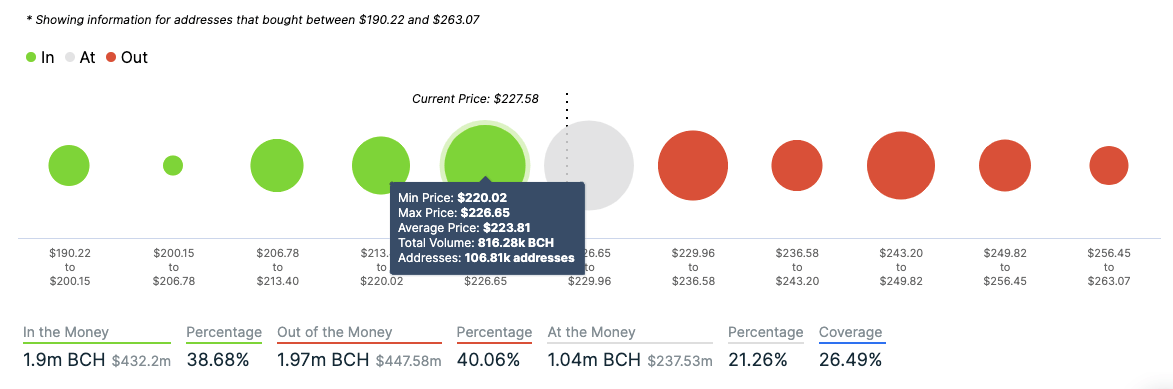
IntoTheBlock’s “In/Out of the Money Around Price” model (IOMAP) shows us that BTC is presently sitting on top of a strong support wall at $223. At this level, around 106,810 addresses had previously purchased 816,280 BCH. As per the IOMAP, this support wall absorbs a lot of the selling pressure, which is preventing the downward trend, for now. However, if the sellers do break below this level, they may have enough momentum to take the price below $200.
On the upside, we have a moderate-to-strong resistance level, $233. In this level, 96,400 addresses had bought 594,000 BCH.
BCH 12-hour chart
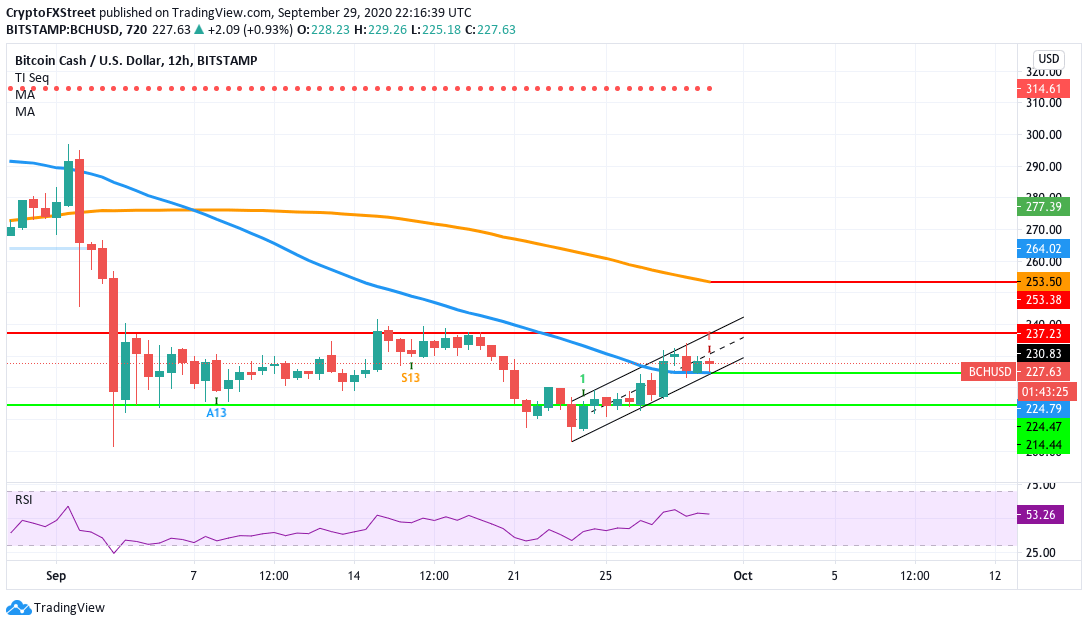
The 12-hour chart helps us gain a better understanding of the potential price action. The latest candlestick has also flashed a sell signal in the TD sequential indicator. To solidify this downtrend, the price must break below the SMA 50 ($224) to have a bearish breakout from the flag formation. Following this, the price will probably drop down to the $214.45 support level. The relative strength index (RSI) is trending around the neutral zone, which shows that the sellers have plenty of room to move before the asset becomes undervalued.
BCH Key levels
Note: All information on this page is subject to change. The use of this website constitutes acceptance of our user agreement. Please read our privacy policy and legal disclaimer. Opinions expressed at FXstreet.com are those of the individual authors and do not necessarily represent the opinion of FXstreet.com or its management. Risk Disclosure: Trading foreign exchange on margin carries a high level of risk, and may not be suitable for all investors. The high degree of leverage can work against you as well as for you. Before deciding to invest in foreign exchange you should carefully consider your investment objectives, level of experience, and risk appetite. The possibility exists that you could sustain a loss of some or all of your initial investment and therefore you should not invest money that you cannot afford to lose. You should be aware of all the risks associated with foreign exchange trading, and seek advice from an independent financial advisor if you have any doubts.
Recommended Content
Editors’ Picks

Bitcoin holds $84,000 despite Fed’s hawkish remarks and spot ETFs outflows
Bitcoin is stabilizing around $84,000 at the time of writing on Thursday after facing multiple rejections around the 200-day EMA at $85,000 since Saturday. Despite risk-off sentiment due to the hawkish remarks by the US Fed on Wednesday, BTC remains relatively stable.

Crypto market cap fell more than 18% in Q1, wiping out $633.5 billion after Trump’s inauguration top
CoinGecko’s Q1 Crypto Industry Report highlights that the total crypto market capitalization fell by 18.6% in the first quarter, wiping out $633.5 billion after topping on January 18, just a couple of days ahead of US President Donald Trump’s inauguration.

Top meme coin gainers FARTCOIN, AIDOGE, and MEW as Trump coins litmus test US SEC ethics
Cryptocurrencies have been moving in lockstep since Monday, largely reflecting sentiment across global markets as United States (US) President Donald Trump's tariffs and trade wars take on new shapes and forms each passing day.

XRP buoyant above $2 as court grants Ripple breathing space in SEC lawsuit
A US appellate court temporarily paused the SEC-Ripple case for 60 days, holding the appeal in abeyance. The SEC is expected to file a status report by June 15, signaling a potential end to the four-year legal battle.
Bitcoin Weekly Forecast: Market uncertainty lingers, Trump’s 90-day tariff pause sparks modest recovery
Bitcoin (BTC) price extends recovery to around $82,500 on Friday after dumping to a new year-to-date low of $74,508 to start the week. Market uncertainty remains high, leading to a massive shakeout, with total liquidations hitting $2.18 billion across crypto markets.

The Best brokers to trade EUR/USD
SPONSORED Discover the top brokers for trading EUR/USD in 2025. Our list features brokers with competitive spreads, fast execution, and powerful platforms. Whether you're a beginner or an expert, find the right partner to navigate the dynamic Forex market.