Bitcoin bullish bounce at 61.8% Fib indicates complex wave 4 pattern
-
Bitcoin (BTC/USD) continued to drop after the break below the 38.2% Fibonacci level. But price action managed to reach the 61.8% Fib rather than just the 50% Fib.
-
Wave 2 (pink) was very shallow so a deeper retrace now makes sense. Because waves 2 and 4 are usually the opposite in their character (shallow vs deep).
-
The current pullback respected the 61.8% Fibonacci support. This could indicate a bullish ABC (blue) pattern towards the previous bottoms (red box).

This deep decline is unusual for a wave 4 but not illogical in this case. Let’s review the Elliott Wave patterns in more detail.
Price charts and technical analysis
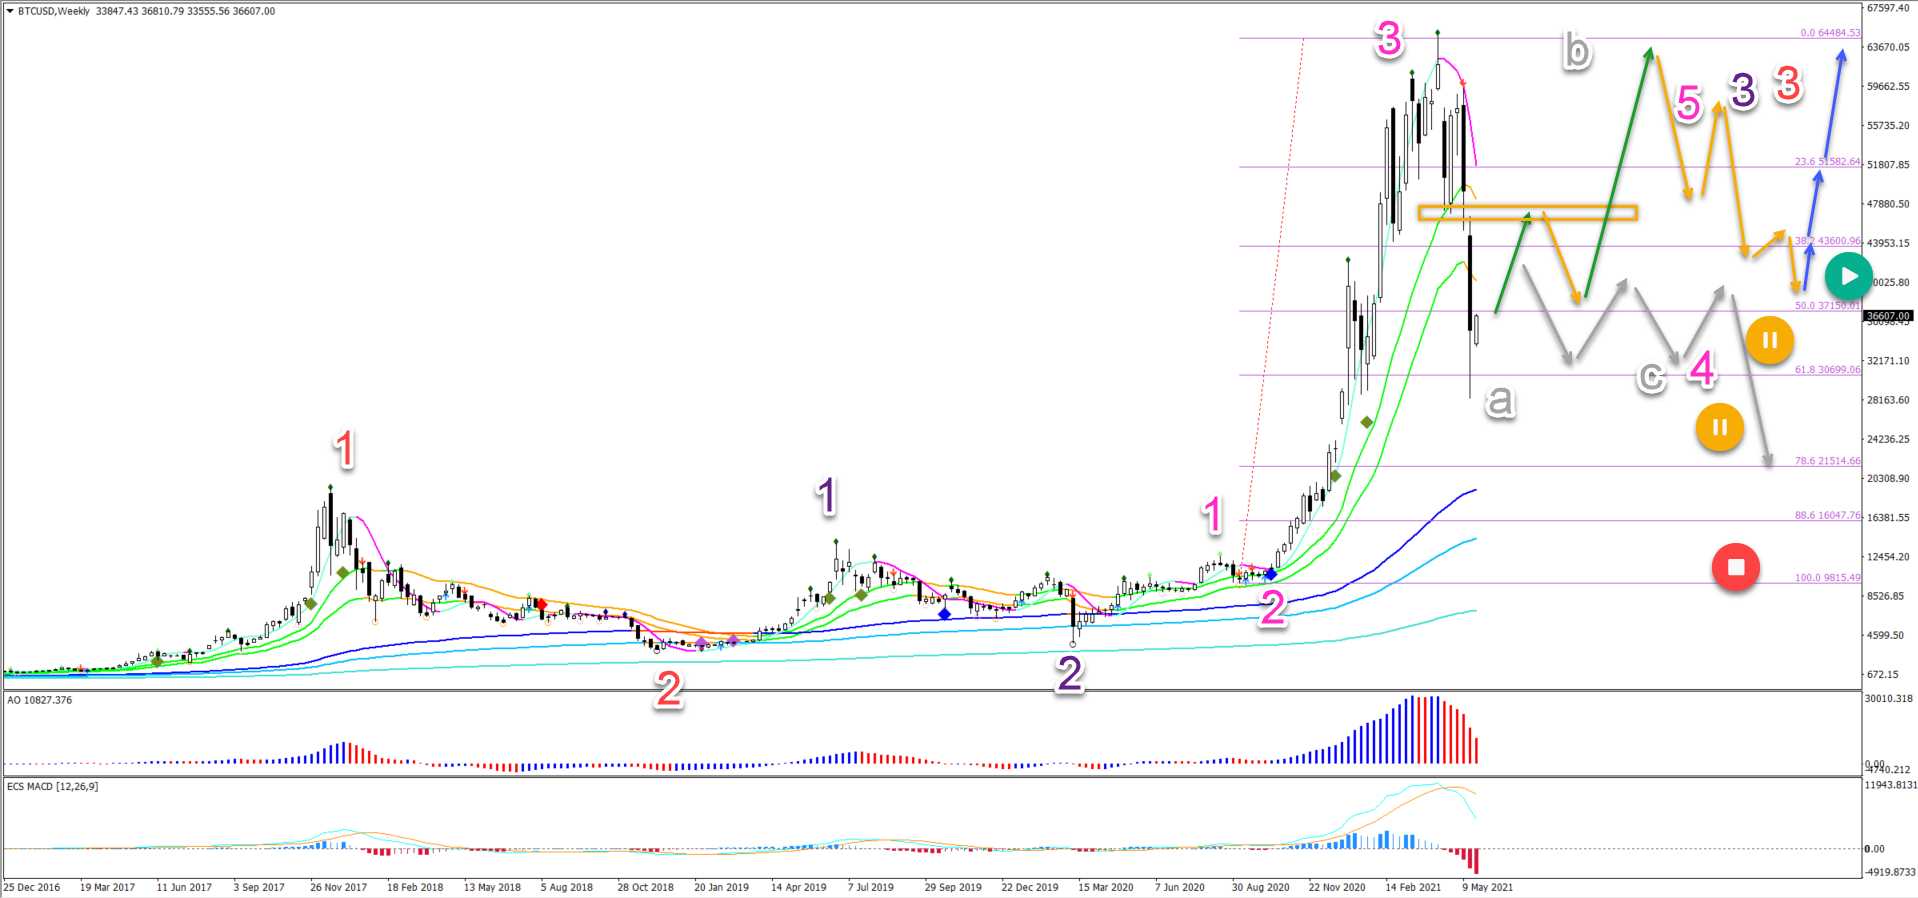
The BTC/USD made a deep retracement in wave 4 (pink). Usually waves 4 retrace only to the 38.2% Fib.
-
But in this case, wave 2 (pink) was very shallow so a deeper retrace now makes sense. Because waves 2 and 4 are usually the opposite in their character (shallow vs deep).
-
Wave 2 was not only shallow but also simple. This means that wave 4 (pink) could also become complex besides being deep.
-
BTCUSD respected and bounced at the 61.8% Fibonacci level. This could indicate the end of the wave A (grey).
-
A bullish bounce (green arrow) could create a retest of the top in wave B (grey).
-
Then another bearish price swing could complete wave C (grey) in wave 4 (pink).
-
Once the ABC (grey) is completed, the wave 4 (pink) could be completed and another uptrend (blue arrows) could start wave 5 (pink).
-
If Bitcoin, however, fails to break above the 21 ema zone on the weekly chart, then the uptrend is probably over (grey arrows).
-
In that case, price action could drop further down after a sideways range.
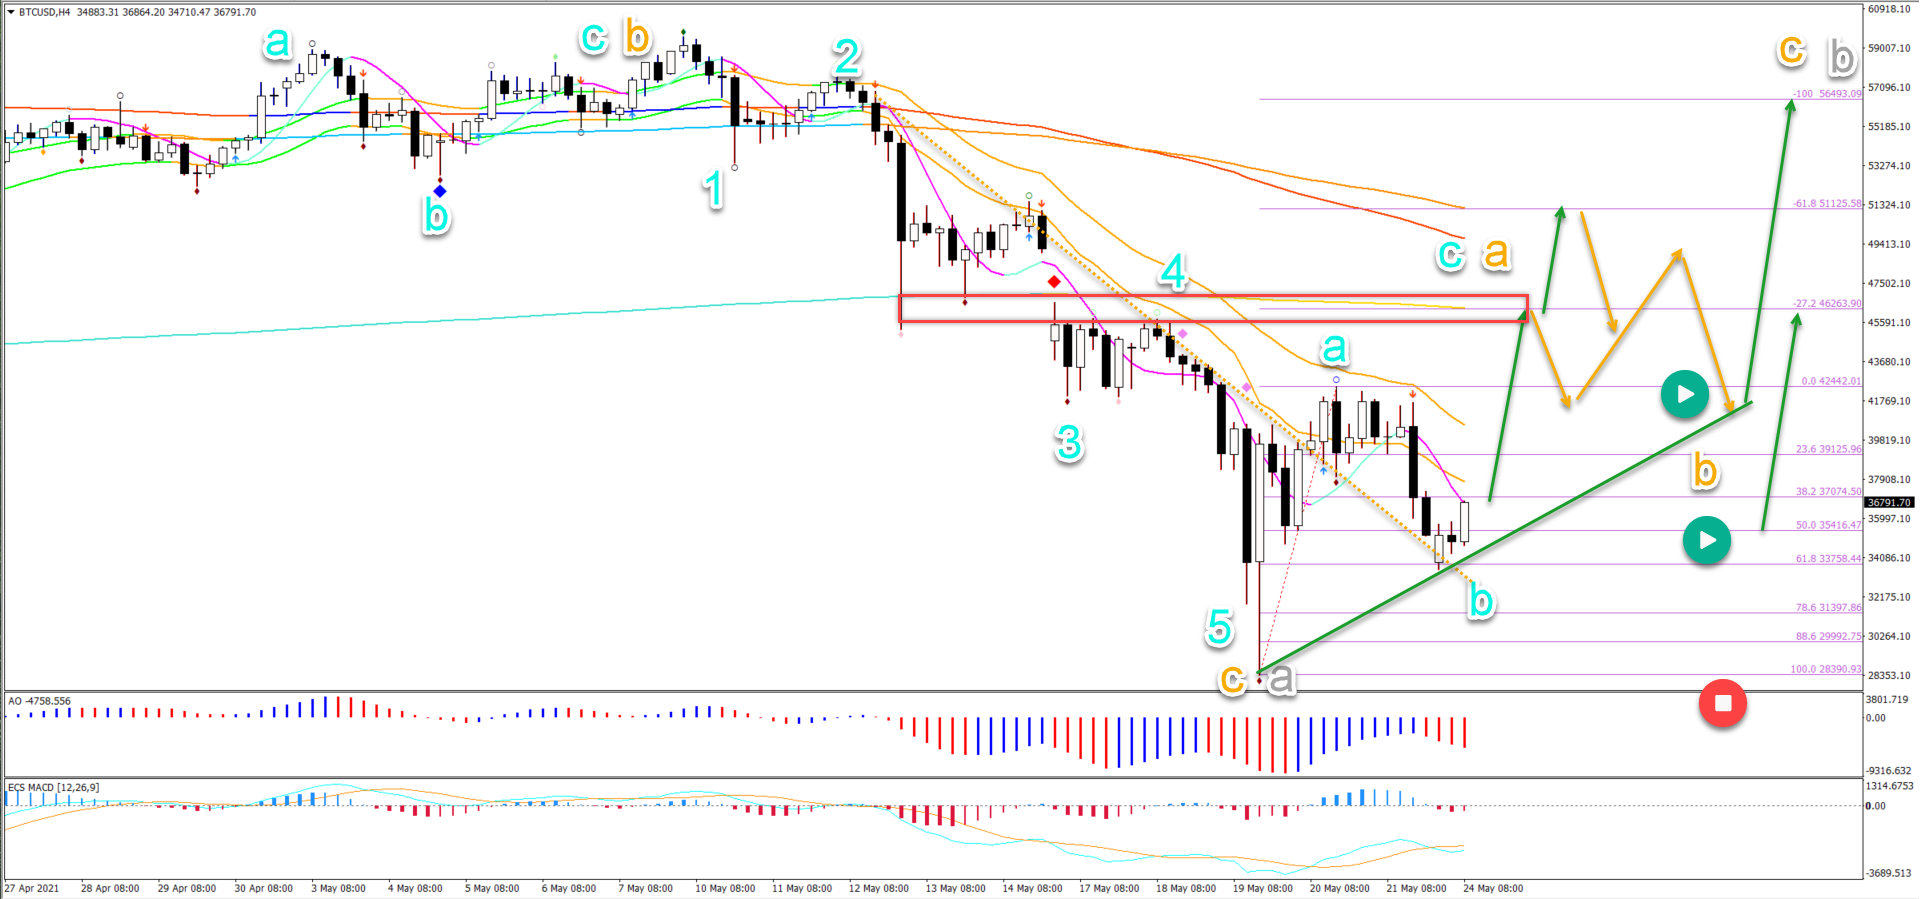
On the 4 hour chart, Bitcoin (BTC/USD) seems to have completed an ABC (blue) in wave B (orange) followed by 5 bearish waves (blue) in wave C (orange):
-
The current pullback respected the 61.8% Fibonacci support.
-
This could indicate a bullish ABC (blue) pattern towards the previous bottoms (red box).
-
The main targets are the -27.2% and -61.8% plus long-term moving averages.
-
A bearish bounce at the target zone could complete wave A (orange) and start wave B (orange).
-
A strong bullish bounce (green arrows) could indicate a wave C up (orange).
-
A break below the bottom invalidates the current wave outlook (red circle).
The analysis has been done with the ecs.SWAT method and ebook.
Author

Chris Svorcik
Elite CurrenSea
Experience Chris Svorcik has co-founded Elite CurrenSea in 2014 together with Nenad Kerkez, aka Tarantula FX. Chris is a technical analyst, wave analyst, trader, writer, educator, webinar speaker, and seminar speaker of the financial markets.