Has the short-term correction of Bitcoin (BTC) finished for now?

A bullish mood has returned to the cryptocurrency market as almost all of the Top 10 coins are green. Bitcoin SV (BSV) is the only exception to the rule, and its rate has declined by 0.22%.

Top 10 coins by Coinstats
Altcoins have been more volatile recently, influenced by the dominance rate of Bitcoin (BTC), which has declined by 2% and is now 54.8%.

The relevant Bitcoin data is looking the following way:
-
Name: Bitcoin
-
Ticker: BTC
-
Market Cap: $192,018,228,025
-
Price: $10,387.78
-
Volume (24h): $56,739,385,123
-
Change (24h): 1.69%
The data is relevant at press time.
BTC/USD: Can bulls get the rate to $10,500 before a drop continues?
Early in the morning yesterday, the price of Bitcoin (BTC) balanced at the level of $10,000. By evening it was already testing the strength of the two-hour EMA55. Despite the fact that the recovery took place at volumes not exceeding the average level, by the end of the day, buyers were able to pierce the moving average EMA55, and in the morning growth continued to the level of $10,400.
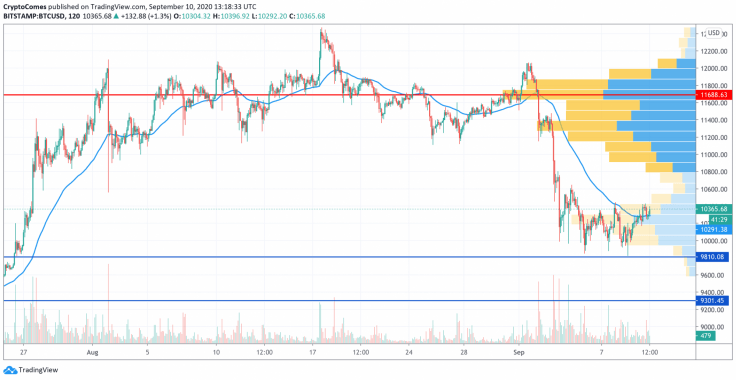
BTC/USD chart by TradingView
Today, a retest of the resistance at $10,500 and a local maximum in the area of $10,640 are possible. Further recovery is still in question. Most likely, with small volumes, the price will not be able to gain a foothold above the level of $10,500 and will return to the area of average prices.
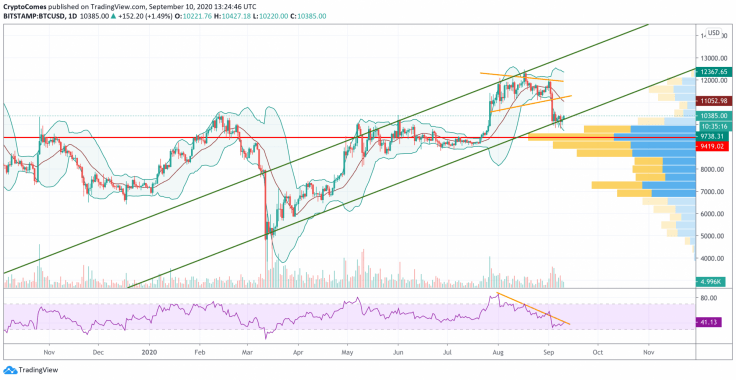
BTC/USD chart by TradingView
On the daily chart, a breakdown of the lower border of the triangle is visible. There is a chance of seeing a decline to the levels of $8,800 and $8,000. Near them, there is the potential of completing the formation of the upward 5-0 pattern. Its development involves an increase in the value of the cryptocurrency to the level of a local maximum..
A strong signal in favor of an increase in price will be the breakdown of the downward trend line on the RSI indicator. Cancellation of the described scenario will be a breakdown of the level of $6,300, at which it is worth considering a decline to the level of $3,895 and below.
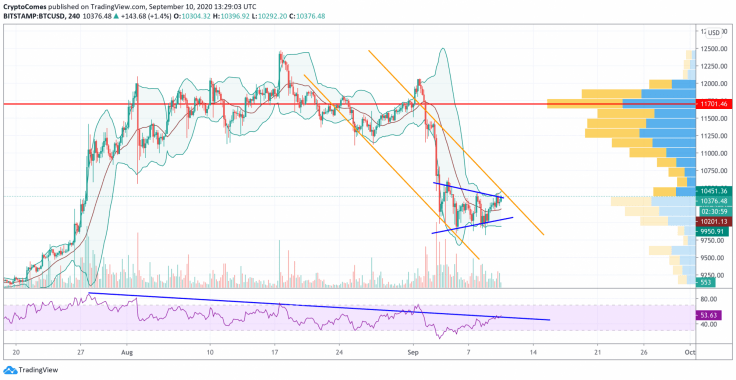
BTC/USD chart by TradingView
On the 4H chart, the price is again squeezed within the next triangle pattern. A breakdown of the lower border of the pattern and a further fall to the level of $8,815 should not be ruled out. An additional signal in favor of this option will be a rebound from the resistance line on the RSI indicator. A confirmation of the downward movement will be a breakdown of the support area with price-fixing below the $9,750 level. Cancellation of the negative option would be the breakdown of the upper border of the descending channel with quotes fixing above $10,705. In this case, one can consider continued growth to the level of $12,495.
Bitcoin is trading at $10,367 at press time.
Read full original article on U.Today
Author

Denys Serhiichuk
U.Today
With more than 5 years of trading, Denys has a deep knowledge of both technical and fundamental market analysis.


