• BTC/USD fades bounce off $36,192 while teasing the confirmation of a bullish chart pattern.
  • RBA official said Bitcoin not a payment instrument, it's not money.
  • Weekly support line, 100-bar SMA add to the downside filters.

BTC/USD eases to $37,100 during early Friday. Even so, the crypto major portrays a bullish chart formation on the four-hour (4H) play and is well keeping the uptrend, as per the MACD and RSI conditions.

The latest pullback could be traced from the downbeat comments from the Reserve Bank of Australia (RBA) official. The RBA assistant governor for financial systems, Michelle Bullock crossed wires recently while saying, “I think there is a lot of fuss over bitcoin and it’s not a payment instrument and it’s not even real money.”

Also challenging the Bitcoin bulls could be the Australian Financial Review (AFR) piece quoting RBA Governor Philip Lowe. Reserve Bank governor Philip Lowe said, “It's a risk to investors but it's not a financial stability risk”, per the news.

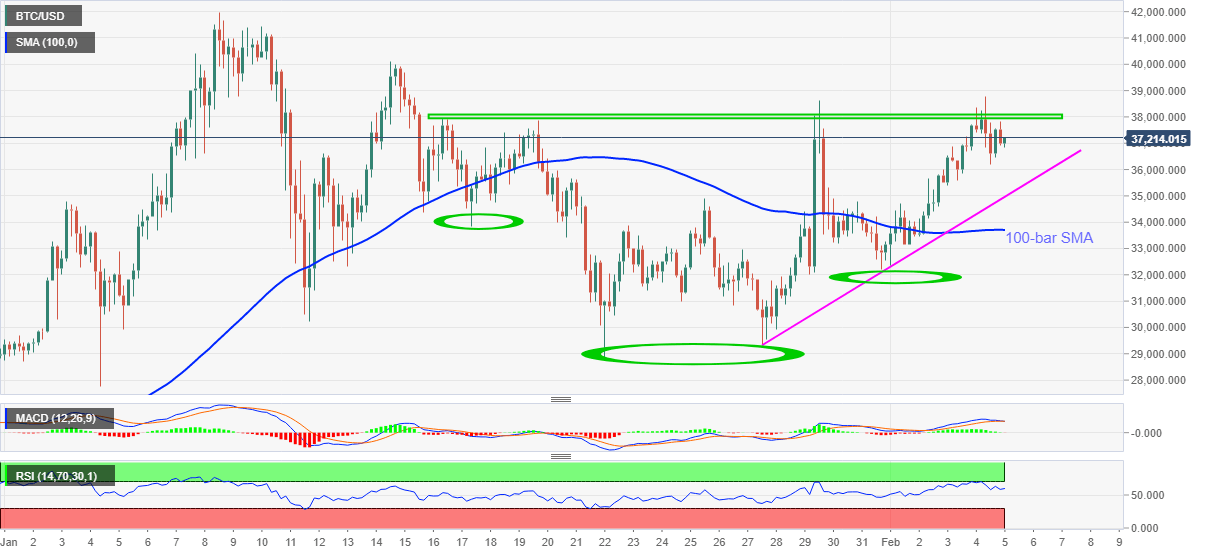
However, the quote’s sustained trading beyond a short-term support line, at $34,970, followed by 100-bar SMA near 33,700 keeps the BTC/USD bulls hopeful towards breaking the $38,000 hurdle and confirms the inverse head-and-shoulders bullish chart pattern.

Following that the theoretical rally towards the $48,000 level may catch a breather around the latest all-time high of $41,987.

Meanwhile, a downside break of 100-bar SMA will trigger a notable change in the current bull-run while also directing short-term bears toward the $30,000 threshold and then to January’s low around $27,780.

BTC/USD daily chart

Trend: Bullish

additional important levels

Overview
Today last price 37146.62
Today Daily Change 162.24
Today Daily Change % 0.44%
Today daily open 36984.38
 
Trends
Daily SMA20 34112.03
Daily SMA50 31955.53
Daily SMA100 24572.11
Daily SMA200 17873.94
 
Levels
Previous Daily High 38758.32
Previous Daily Low 36192.11
Previous Weekly High 38638.78
Previous Weekly Low 29239.87
Previous Monthly High 41987.21
Previous Monthly Low 27772
Daily Fibonacci 38.2% 37172.4
Daily Fibonacci 61.8% 37778.03
Daily Pivot Point S1 35864.88
Daily Pivot Point S2 34745.39
Daily Pivot Point S3 33298.67
Daily Pivot Point R1 38431.1
Daily Pivot Point R2 39877.82
Daily Pivot Point R3 40997.32


Information on these pages contains forward-looking statements that involve risks and uncertainties. Markets and instruments profiled on this page are for informational purposes only and should not in any way come across as a recommendation to buy or sell in these assets. You should do your own thorough research before making any investment decisions. FXStreet does not in any way guarantee that this information is free from mistakes, errors, or material misstatements. It also does not guarantee that this information is of a timely nature. Investing in Open Markets involves a great deal of risk, including the loss of all or a portion of your investment, as well as emotional distress. All risks, losses and costs associated with investing, including total loss of principal, are your responsibility. The views and opinions expressed in this article are those of the authors and do not necessarily reflect the official policy or position of FXStreet nor its advertisers. The author will not be held responsible for information that is found at the end of links posted on this page.

If not otherwise explicitly mentioned in the body of the article, at the time of writing, the author has no position in any stock mentioned in this article and no business relationship with any company mentioned. The author has not received compensation for writing this article, other than from FXStreet.

FXStreet and the author do not provide personalized recommendations. The author makes no representations as to the accuracy, completeness, or suitability of this information. FXStreet and the author will not be liable for any errors, omissions or any losses, injuries or damages arising from this information and its display or use. Errors and omissions excepted.

The author and FXStreet are not registered investment advisors and nothing in this article is intended to be investment advice.

Join Telegram

Recommended content


Recommended Content

Editors’ Picks

Celebrity meme coins controversy continues amid Pump.fun revenue dominance

Celebrity meme coins controversy continues amid Pump.fun revenue dominance

Pump.fun outperformed the Ethereum blockchain on Tuesday after raking in $1.99 million. Following this achievement, a meme coin based on actress Sydney Sweeney was the subject of controversy after its developers dumped their bags on investors.

More Meme Coins News

PEPE's on-chain metrics indicate potential rally after weeks of silence

PEPE's on-chain metrics indicate potential rally after weeks of silence

PEPE has struggled to see any significant price move after reaching an all-time high in May. Increased adoption rate and low MVRV ratio indicate a bullish run may be on the horizon. A single PEPE outflow from Binance worth $14.7 million gives credence to signs of bullish expectation.

More Pepe News

Ethereum has failed to overcome key resistance despite bullish sentiment surrounding ETH ETF

Ethereum has failed to overcome key resistance despite bullish sentiment surrounding ETH ETF

Ethereum (ETH) is down more than 1.4% on Tuesday following another ETH sale from the Ethereum Foundation. Meanwhile, crypto exchange Gemini's recent report reveals that ETH ETF could see about $5 billion in net inflows within six months of launch.

More Ethereum News

Crypto community blasts Polkadot following report of treasury spending

Crypto community blasts Polkadot following report of treasury spending

Polkadot reports $87 million of treasury spending during H1. Crypto community members expressed harsh feelings toward the DOT team's high spending. DOT is up more than 2% in the past 24 hours but risks correction following the report.

More Polkadot News

Bitcoin: BTC price correction could end in July, according to seasonal data

Bitcoin: BTC price correction could end in July, according to seasonal data

Bitcoin (BTC) price appears poised for a decline this week, influenced by slight outflows in US spot ETFs, selling activity among BTC miners, and a combined transfer of 4,690.28 BTC to centralized exchanges by the US and German governments.

Read full analysis

BTC

ETH

XRP