Biotech ETF (XBI) ended a diagonal: Looking for buying dips

The SPDR S&P Biotech ETF (XBI) is an exchange-traded fund that tracks the biotechnology segment of the S&P Total Market Index. This ETF allows investors to gain exposure to large, mid, and small-cap biotech stocks. If you’re interested in biotechnology, XBI could be worth exploring further. Here are some of its top holdings and their percentage weights: United Therapeutics Corporation (UTHR): 2.92%. Exact Sciences Corporation (EXAS): 2.91%. Gilead Sciences, Inc. (GILD): 2.89%. Sarepta Therapeutics, Inc. (SRPT): 2.87%. Amgen Inc. (AMGN): 2.84%. Alnylam Pharmaceuticals, Inc. (ALNY): 2.65%. Regeneron Pharmaceuticals, Inc. (REGN): 2.64%. Vertex Pharmaceuticals Incorporated (VRTX): 2.60%. AbbVie Inc. (ABBV): 2.60%. BioMarin Pharmaceutical Inc. (BMRN): 2.56%.
In July, we explained how we bought a blue box on XBI and how we generated over 18% in profits. In addition, we kept open the possibility that the ETF will continue to rise and could reach around 108.45. To see how we handled the trade from the blue box, you can check out the old blog here: Biotech ETF (XBI) Rallied from the Blue Box Hitting Target
XBI weekly chart March 23rd 2024
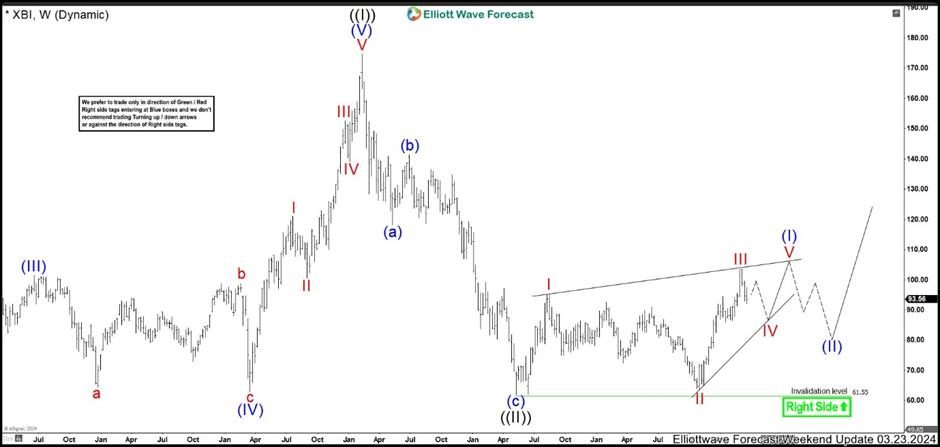
In the chart above for the month of March, we can see the path we are expecting for XBI. It had finished a Great Super Cycle at 174.79 high and then made a correction. The pullback developed a zig zag structure where wave (a) ended at 118.23 low. Immediately, we had a short wave (b) that reached 141.50 high and then resumed with the bearish movement. Wave (c) extended reaching the 61.78 low to complete wave ((II)). At this point, we looked for a bullish continuation; however, by that date the structure was not clear. Since with only have 3 waves, it could be a diagonal or a nest-type structure. The coincidence with the 2 structures is that both had to correct before continuing upwards and we lean towards the diagonal because it is more conservative, as we see in the chart.
XBI weekly chart November 25th 2024
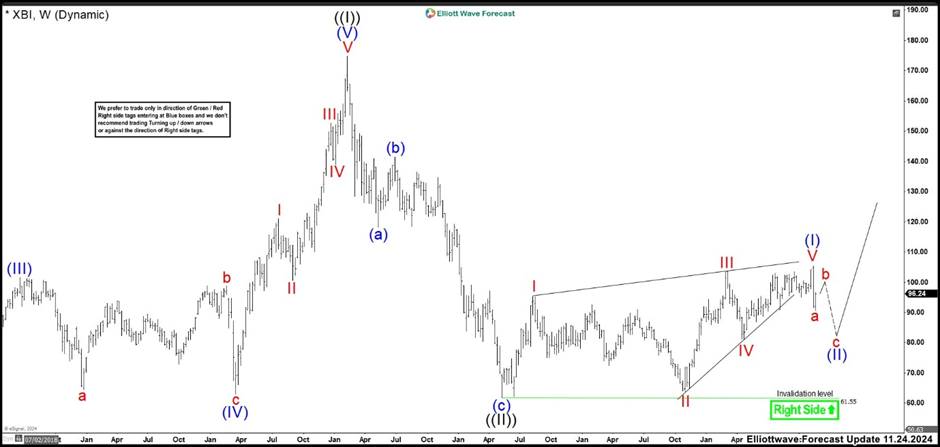
The wave I of the diagonal ended at 95.17 high. Then wave II built a zig zag correction with a flat structure in the middle. This pullback ended at 63.80 low and rally again. Wave III did a strong rally as wave I reaching 103.53 high. The retracement as wave IV finished at 81.14. The last push to the upside was a little irregular. It could be labeled as a ending diagonal to 105.47 high, completing wave V and wave (I). Currently, the wave (II) has started adn we are looking to end 3, 7 or 11 swings correction where we like to buy the dips against 61.78 low.
Author

Elliott Wave Forecast Team
ElliottWave-Forecast.com


