• Binance has recently removed 1.68 million BNB tokens during its quarterly burn.
  • Unlike the previous quarters, the exchange has introduced a new system of destroying tokens from circulation.
  • Binance Coin price may be headed for a bullish reversal as a key technical indicator flashed a bottom signal. 

Leading cryptocurrency exchange Binance recently burned over 1.68 million of its BNB tokens worth approximately $800 million. The trading platform carried out its 18th burn and completed the first quarterly BNB Auto-Burn.

Binance introduces BNB Auto-Burn

Since Binance and its exchange token was launched in 2017, the firm has committed to removing 100 million BNB or half of the total supply in circulation through burning. 

Previous quarterly burns were based on the tokens’ usage and revenue generated on the exchange. During the last quarterly burn, Binance removed 1.34 million BNB in circulation. Other burns ranged from 808,000 BNB to 3.6 million BNB burned.

Following the community’s feedback, the BNB Auto-Burn was introduced to allow for a more objective process independent of the centralized ecosystem.

The burning system calculates how many tokens to remove from circulation based on the price of BNB, which reflects on demand and the number of blocks produced in the quarter.

Coin burning processes are usually used to reduce the supply of tokens in circulation to raise the demand for the coins in circulation, keeping prices reasonably high. 

Binance Coin price prepares to bounce back

Binance Coin price has formed an ascending parallel channel on the daily chart, suggesting an overall bullish outlook for BNB.

The Momentum Reversal Indicator (MRI) has recently flashed a bottom signal as BNB reached the lower boundary of the governing technical pattern, suggesting that Binance Coin price is preparing for a rebound. 

The first line of resistance for BNB may appear at the 21-day Simple Moving Average (SMA) at $487, then at the 50-day SMA at $530, coinciding with the 61.8% Fibonacci retracement level and the 100-day SMA. 

BNBUSDT

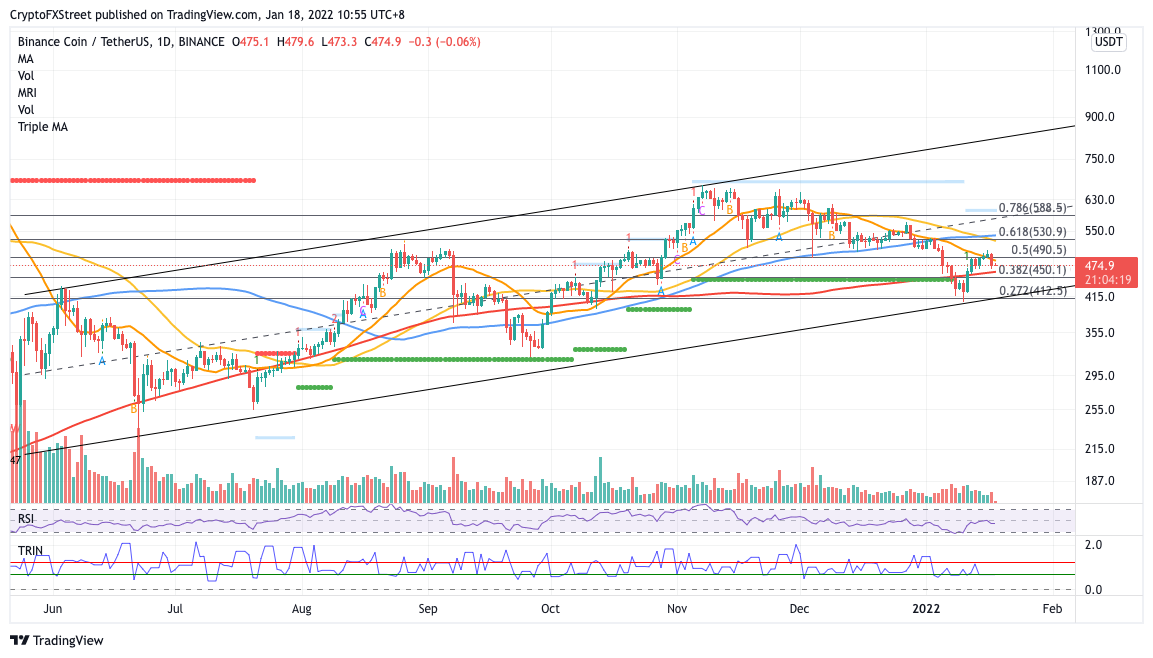
BNB/USDT daily chart

A spike in buy orders may incentivize the bulls to target the middle boundary of the prevailing chart pattern at $588, which intersects with the 78.6% Fibonacci retracement level.

However, an increase in selling pressure may see Binance Coin price slide toward the 200-day SMA at $450, which sits near the 38.2% Fibonacci retracement level.


Note: All information on this page is subject to change. The use of this website constitutes acceptance of our user agreement. Please read our privacy policy and legal disclaimer. Opinions expressed at FXstreet.com are those of the individual authors and do not necessarily represent the opinion of FXstreet.com or its management. Risk Disclosure: Trading foreign exchange on margin carries a high level of risk, and may not be suitable for all investors. The high degree of leverage can work against you as well as for you. Before deciding to invest in foreign exchange you should carefully consider your investment objectives, level of experience, and risk appetite. The possibility exists that you could sustain a loss of some or all of your initial investment and therefore you should not invest money that you cannot afford to lose. You should be aware of all the risks associated with foreign exchange trading, and seek advice from an independent financial advisor if you have any doubts.

Join Telegram

Recommended content


Recommended Content

Editors’ Picks

Ripple on-chain metrics show bullish signs amidst legal struggle with SEC, XRP eyes recovery

Ripple on-chain metrics show bullish signs amidst legal struggle with SEC, XRP eyes recovery

Ripple made a comeback above $0.48 on Tuesday and hovers above that level in Wednesday’s European session. Ripple on-chain metrics such as transaction volume and Network Realized Profit/Loss have turned bullish, supporting a recovery in the altcoin. 

More Ripple News

Bitcoin price falls amidst German government transfers, miners activity

Bitcoin price falls amidst German government transfers, miners activity

Bitcoin (BTC) extends correction on Wednesday and hovers around $61,000 after finding resistance near the $64,000 level on Monday. Recent on-chain data indicates heightened selling activity from Bitcoin miners early in the week. 

More Bitcoin News

Crypto Today: Bitcoin erases gains from end of June, Ethereum declines while Ripple holds

Crypto Today: Bitcoin erases gains from end of June, Ethereum declines while Ripple holds

Bitcoin wipes out gains from the last week of June and falls below $60,000 on Wednesday. Ethereum and top altcoins ranked by market capitalization erased gains as the inflation outlook worsened. Ripple holds on to recent gains and hovers above $0.48 on Wednesday. 

More Cryptocurrencies News

Three reasons why altcoins could shake off losses this week

Three reasons why altcoins could shake off losses this week

On-chain data from Santiment shows that altcoins are currently in the opportunity zone, or generating buy signals. The top three altcoins in the buy zone are Basic Attention Token (BAT), Chromia (CHR), and Highstreet (HIGH), per Santiment. 

More Altcoins News

Bitcoin: BTC price correction could end in July, according to seasonal data

Bitcoin: BTC price correction could end in July, according to seasonal data

Bitcoin (BTC) price appears poised for a decline this week, influenced by slight outflows in US spot ETFs, selling activity among BTC miners, and a combined transfer of 4,690.28 BTC to centralized exchanges by the US and German governments.

Read full analysis

BTC

ETH

XRP