Binance Elliott Wave technical analysis [Video]
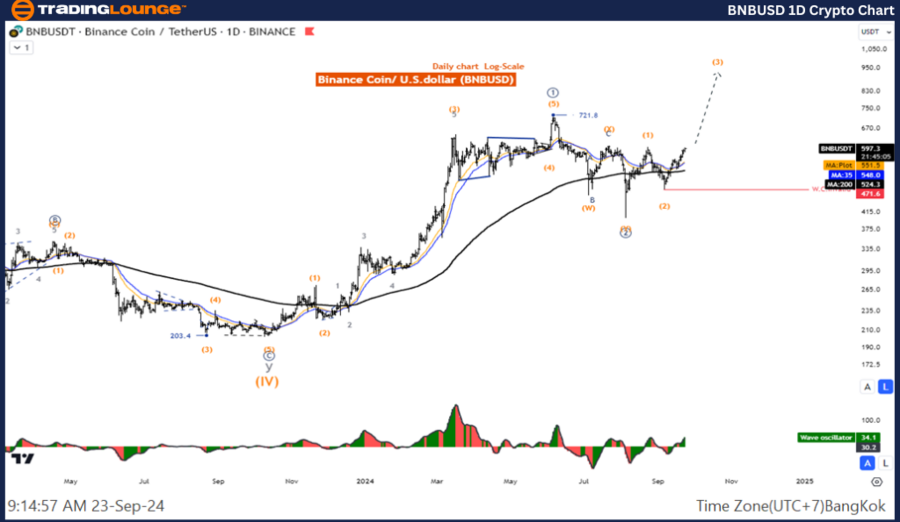
Elliott Wave Analysis TradingLounge daily chart.
Binance/ U.S. dollar(BNBUSD)
BNB/USD Elliott Wave technical analysis
Function: Counter Trend.
Mode: Corrective.
Structure: Double Corrective.
Position: Wave ((Y)).
Direction next higher degrees: Wave (2).
Details: Wave (2) is likely to end and the price is re-entering the uptrend.
Binance/ U.S. dollar (BNBUSD) trading strategy: The correction in wave ((2)) seems to be over so we focus on the five-wave rally of wave 3 and the price is likely to test the 913 level. The price action remains in an uptrend, looking for a re-entry into the trend.
Binance/ U.S. dollar(BNBUSD)Technical Indicators: The price is above the MA200 indicating an uptrend, The Wave Oscillator is a Bullish Momentum.
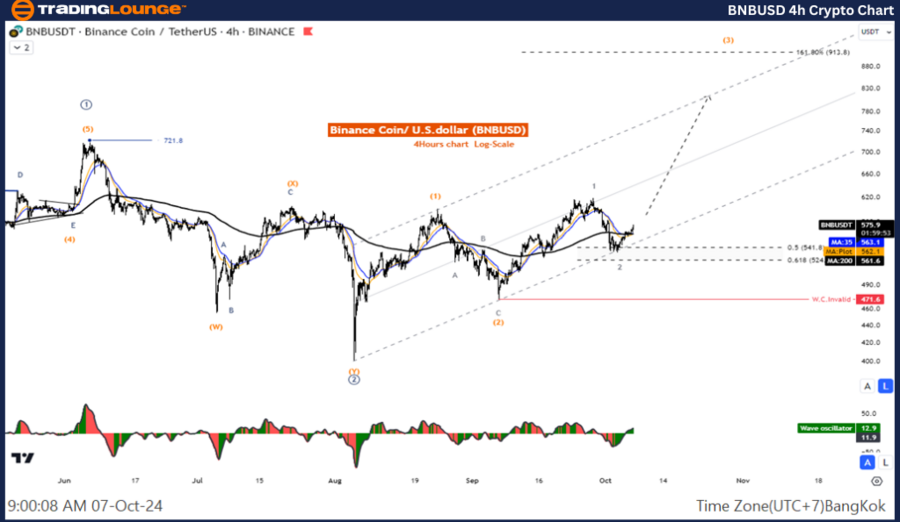
BNB/USD Elliott Wave technical analysis
Function: Counter Trend.
Mode: Corrective.
Structure: Double Corrective.
Position: Wave ((Y)).
Direction next higher degrees: Wave 2.
Details: The decline of wave Y is likely to end and the price is re-entering the uptrend.
Binance/ U.S. dollar (BNBUSD) trading strategy: The correction in wave ((2)) seems to be over so we focus on the five-wave rally of wave 3 and the price is likely to test the 913 level. The price action remains in an uptrend, and we are looking for a re-entry into the trend.
Binance/ U.S. dollar (BNBUSD) Technical Indicators: The price is above the MA200 indicating an uptrend, The Wave Oscillator is a Bullish Momentum.
Binance Elliott Wave technical analysis [Video]
Author

Peter Mathers
TradingLounge
Peter Mathers started actively trading in 1982. He began his career at Hoei and Shoin, a Japanese futures trading company.


