• Binance Coin is set to drop significantly because of current worsening market conditions and tail risks.
  • BNB price could drop as much as 30% and see all its gains for the summer erased. 
  • The risk could be that even the low of this year gets tested.

Binance Coin (BNB) price is getting hammered as some cryptocurrencies are trying to put up a fight against the bears. With the summer rally on its final legs, traders are coming back into the office and are picking up where they left off, with plenty of tail risks and issues looking forward. To make matters worse, a textbook technical charting pattern agrees with the souring turn in market sentiment and hints at more losses to come.

BNB price is under pressure from inverted cup and handle pattern

Binance Coin has been having issues since it tried to break above the 200-day Simple Moving Average (SMA) at the beginning of August, unable to recover since then from the firm rejection it underwent. 

With already over 10% lost currently to date, unfortunately, the pain is not over yet for BNB bulls, as more and more geopolitical issues and tensions are rising. The USdollar strength is adding more risk. That means that any upside in BNB price action will be limited for now and rather looks to take another step back towards the lower end of $200.

BNB price is nearby that round level in a bearish technical setup called the inverted cup and handle pattern. On the graph below, you can see in blow drawing how that technical setup can be identified and which way it will go. It boils down to bulls being trapped in the handle on the idea that recovery with new highs above the cup is on its way. Instead, BNB bulls are set to be washed out and squeezed out of their positions with price action running into the ground and bears pushing to hit $212 as a target, with the risk of overshooting towards $180 in case losses get eeked out even further should a perfect storm occur.
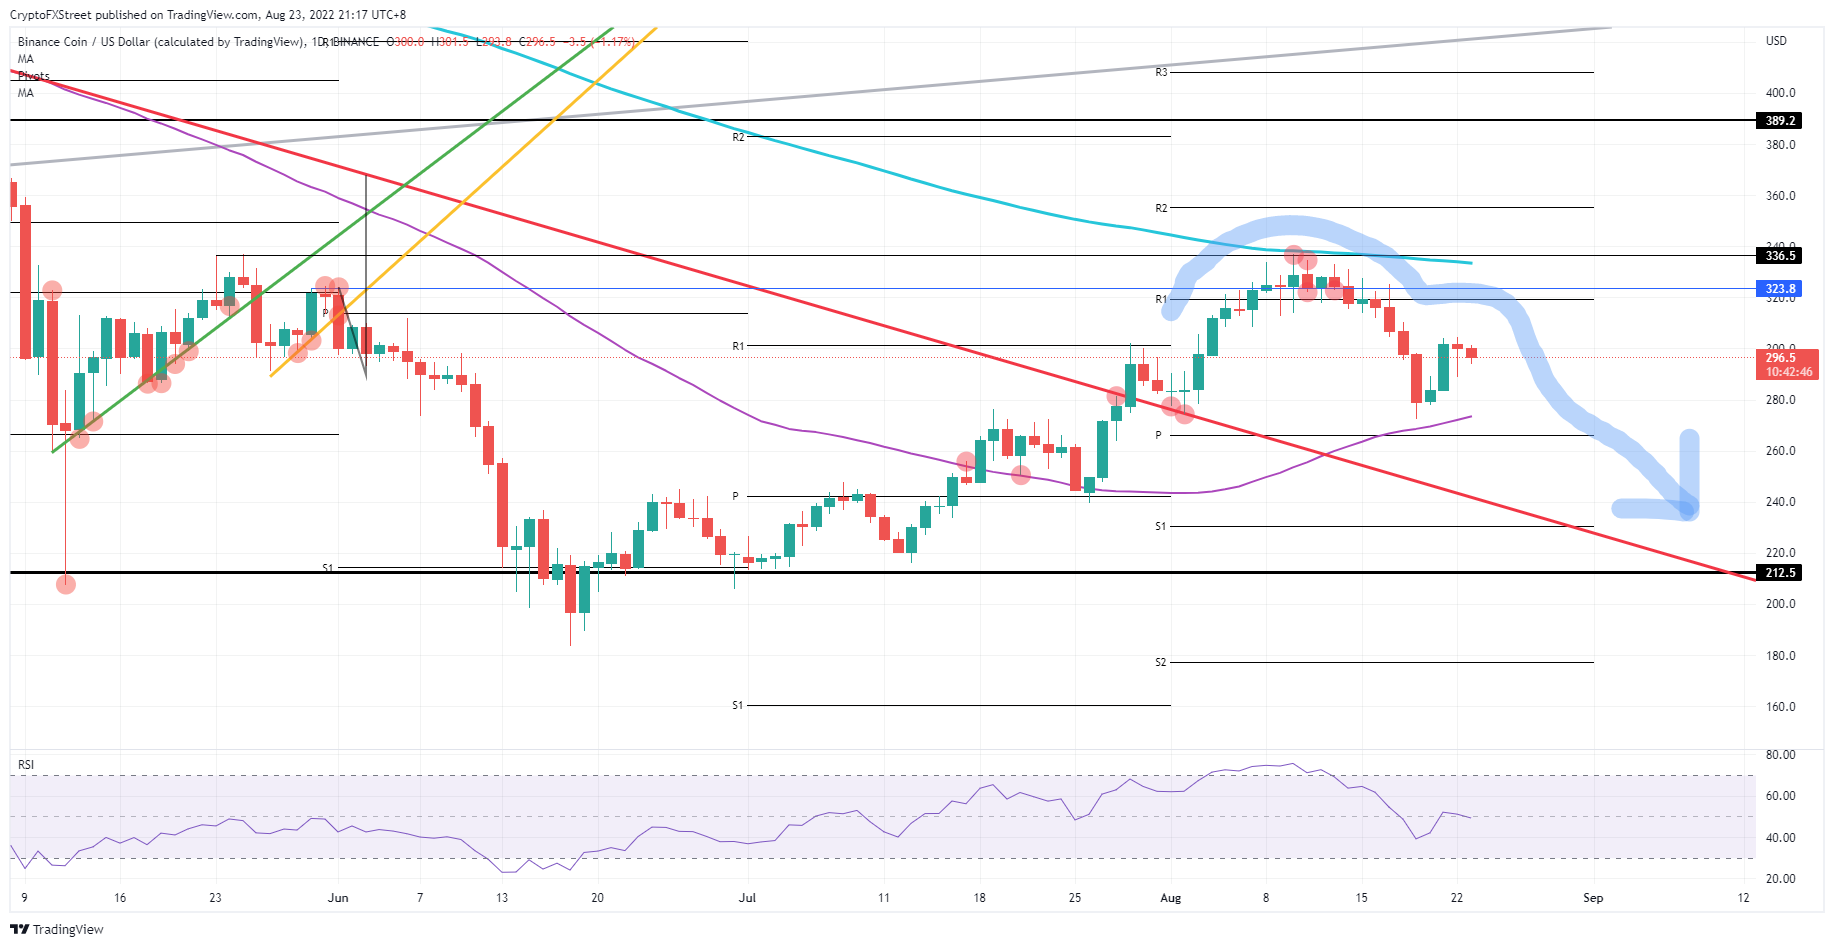
BNB/USD Daily chart

BNB/USD Daily chart

However, price action is still underpinned in Binance Coin, with the 55-day SMA still hovering below the lows of the past few days or weeks. This means that bulls still have a fail-safe element that is trading alongside them to catch and support any slippages along the way higher. Should that 55-day SMA prove strong enough to break the bearish pattern, expect to see a BNB rally towards $340 by retesting and breaking the 200-day SMA to the upside.


Information on these pages contains forward-looking statements that involve risks and uncertainties. Markets and instruments profiled on this page are for informational purposes only and should not in any way come across as a recommendation to buy or sell in these assets. You should do your own thorough research before making any investment decisions. FXStreet does not in any way guarantee that this information is free from mistakes, errors, or material misstatements. It also does not guarantee that this information is of a timely nature. Investing in Open Markets involves a great deal of risk, including the loss of all or a portion of your investment, as well as emotional distress. All risks, losses and costs associated with investing, including total loss of principal, are your responsibility. The views and opinions expressed in this article are those of the authors and do not necessarily reflect the official policy or position of FXStreet nor its advertisers. The author will not be held responsible for information that is found at the end of links posted on this page.

If not otherwise explicitly mentioned in the body of the article, at the time of writing, the author has no position in any stock mentioned in this article and no business relationship with any company mentioned. The author has not received compensation for writing this article, other than from FXStreet.

FXStreet and the author do not provide personalized recommendations. The author makes no representations as to the accuracy, completeness, or suitability of this information. FXStreet and the author will not be liable for any errors, omissions or any losses, injuries or damages arising from this information and its display or use. Errors and omissions excepted.

The author and FXStreet are not registered investment advisors and nothing in this article is intended to be investment advice.

Join Telegram

Recommended content


Recommended Content

Editors’ Picks

Ripple on-chain metrics show bullish signs amidst legal struggle with SEC, XRP eyes recovery

Ripple on-chain metrics show bullish signs amidst legal struggle with SEC, XRP eyes recovery

Ripple made a comeback above $0.48 on Tuesday and hovers above that level in Wednesday’s European session. Ripple on-chain metrics such as transaction volume and Network Realized Profit/Loss have turned bullish, supporting a recovery in the altcoin. 

More Ripple News

Bitcoin price falls amidst German government transfers, miners activity

Bitcoin price falls amidst German government transfers, miners activity

Bitcoin (BTC) extends correction on Wednesday and hovers around $61,000 after finding resistance near the $64,000 level on Monday. Recent on-chain data indicates heightened selling activity from Bitcoin miners early in the week. 

More Bitcoin News

Crypto Today: Bitcoin erases gains from end of June, Ethereum declines while Ripple holds

Crypto Today: Bitcoin erases gains from end of June, Ethereum declines while Ripple holds

Bitcoin wipes out gains from the last week of June and falls below $60,000 on Wednesday. Ethereum and top altcoins ranked by market capitalization erased gains as the inflation outlook worsened. Ripple holds on to recent gains and hovers above $0.48 on Wednesday. 

More Cryptocurrencies News

Three reasons why altcoins could shake off losses this week

Three reasons why altcoins could shake off losses this week

On-chain data from Santiment shows that altcoins are currently in the opportunity zone, or generating buy signals. The top three altcoins in the buy zone are Basic Attention Token (BAT), Chromia (CHR), and Highstreet (HIGH), per Santiment. 

More Altcoins News

Bitcoin: BTC price correction could end in July, according to seasonal data

Bitcoin: BTC price correction could end in July, according to seasonal data

Bitcoin (BTC) price appears poised for a decline this week, influenced by slight outflows in US spot ETFs, selling activity among BTC miners, and a combined transfer of 4,690.28 BTC to centralized exchanges by the US and German governments.

Read full analysis

BTC

ETH

XRP