- Binance Coin recovers lost ground above $70 as buyers look toward $100.
- The Parabolic SAR and the MACD are reinforcing the uptrend.
- The MVRV ratio is at the highest level in history, which calls for caution among investors.
Binance Coin is among the digital assets that have outperformed themselves in the market this year. Recently, BNB achieved a new all-time high of $76, but it looks primed to rally toward $100.
Binance Coin uptrend resumes
The 12-hour chart shows BNB trading at $71 after rebounding from the most recent support at $64. Closing the day above $70 was particularly very bullish and seemed to have called buyers back into the market. For now, bulls aim to overcome the resistance at $76 and push for gains heading to $100.
Binance Coin is currently trading above the Parabolic SAR points, which is a bullish signal that the uptrend is bound to continue. The Moving Average Convergence Divergence (MACD) in the same timeframe has also reinforced the bullish outlook as it moves higher above the midline. Besides, the MACD line (blue) is also widening the divergence from the signal line.
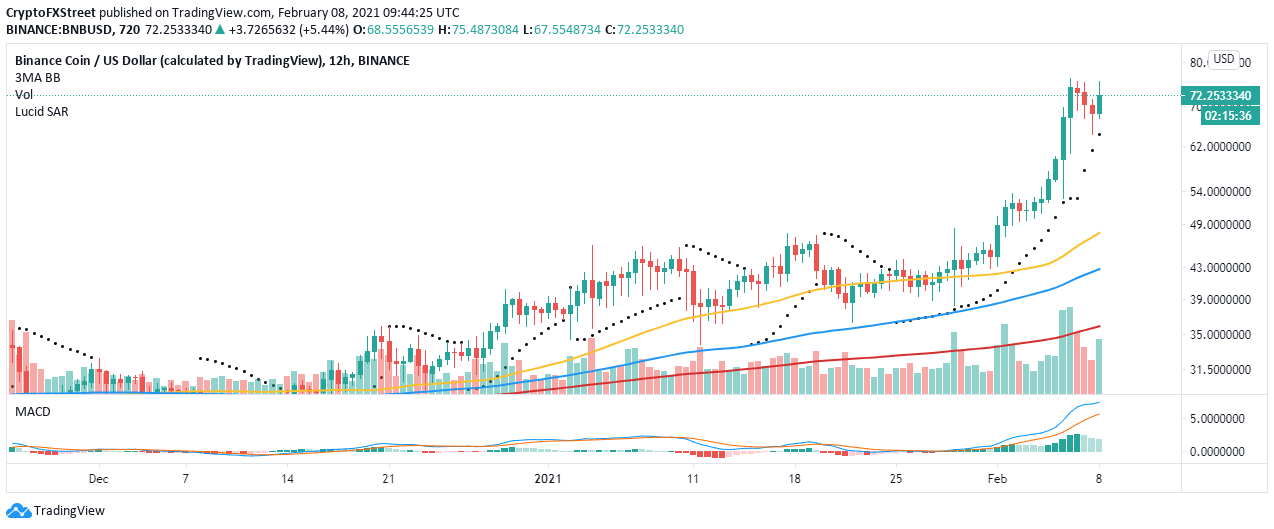
BNB/USD 12-hour chart
Looking at the other side of the fence
It is interesting to realize that as Binance Coin's value soars, some whales are offloading. This shows that all of the Binance Coin holders are perhaps in profit, and therefore, it makes sense to sell. However, if the selling pressure continues, it would be an uphill task to swing to $100.
Santiment's holder distribution shows that addresses between 100,000 and 10 million BNB topped out at 34 on January 26. Over the last week or so, these addresses have decreased to 30, representing an 11.8% decline.
%20[12.53.18,%2008%20Feb,%202021]-637483765503742985.png)
Binance Coin holder distribution
The MVRV model by Santiment also brings to light the possibility of a retreat. This on-chain metric tracks the average profit or loss incurred by the holders of BNB. The ratio is arrived at by narrowing down on the tokens moved over the last 30 days compared to the tokens' price when they last moved.
%20[13.03.02,%2008%20Feb,%202021]-637483765649420778.png)
Binance Coin MVRV model
It is worth mentioning that the MVRV is showing a reading of more than 50% (the highest in the history of the BNB). This calls for caution among investors because a price reversal is possible in the near term, as shown by the MVRV ratio.
Information on these pages contains forward-looking statements that involve risks and uncertainties. Markets and instruments profiled on this page are for informational purposes only and should not in any way come across as a recommendation to buy or sell in these assets. You should do your own thorough research before making any investment decisions. FXStreet does not in any way guarantee that this information is free from mistakes, errors, or material misstatements. It also does not guarantee that this information is of a timely nature. Investing in Open Markets involves a great deal of risk, including the loss of all or a portion of your investment, as well as emotional distress. All risks, losses and costs associated with investing, including total loss of principal, are your responsibility. The views and opinions expressed in this article are those of the authors and do not necessarily reflect the official policy or position of FXStreet nor its advertisers. The author will not be held responsible for information that is found at the end of links posted on this page.
If not otherwise explicitly mentioned in the body of the article, at the time of writing, the author has no position in any stock mentioned in this article and no business relationship with any company mentioned. The author has not received compensation for writing this article, other than from FXStreet.
FXStreet and the author do not provide personalized recommendations. The author makes no representations as to the accuracy, completeness, or suitability of this information. FXStreet and the author will not be liable for any errors, omissions or any losses, injuries or damages arising from this information and its display or use. Errors and omissions excepted.
The author and FXStreet are not registered investment advisors and nothing in this article is intended to be investment advice.
Recommended Content
Editors’ Picks

Shiba Inu eyes positive returns in April as SHIB price inches towards $0.000015
Shiba Inu's on-chain metrics reveal robust adoption, as addresses with balances surge to 1.4 million. Shiba Inu's returns stand at a solid 14.4% so far in April, poised to snap a three-month bearish trend from earlier this year.

AI tokens TAO, FET, AI16Z surge despite NVIDIA excluding crypto-related projects from its Inception program
AI tokens, including Bittensor and Artificial Superintelligence Alliance, climbed this week, with ai16z still extending gains at the time of writing on Friday. The uptick in prices of AI tokens reflects a broader bullish sentiment across the cryptocurrency market.

Bitcoin Weekly Forecast: BTC consolidates after posting over 10% weekly surge
Bitcoin price is consolidating around $94,000 at the time of writing on Friday, holding onto the recent 10% increase seen earlier this week. This week’s rally was supported by strong institutional demand, as US spot ETFs recorded a total inflow of $2.68 billion until Thursday.

XRP price could renew 25% breakout bid on surging institutional and retail adoption
Ripple price consolidates, trading at $2.18 at the time of writing on Friday, following mid-week gains to $2.30. The rejection from this weekly high led to the price of XRP dropping to the previous day’s low at $2.11, followed by a minor reversal.
Bitcoin Weekly Forecast: BTC consolidates after posting over 10% weekly surge
Bitcoin (BTC) price is consolidating around $94,000 at the time of writing on Friday, holding onto the recent 10% increase seen earlier this week.

The Best brokers to trade EUR/USD
SPONSORED Discover the top brokers for trading EUR/USD in 2025. Our list features brokers with competitive spreads, fast execution, and powerful platforms. Whether you're a beginner or an expert, find the right partner to navigate the dynamic Forex market.