Binance Coin Technical Analysis: BNB breakdown imminent despite positive on-chain activity
- Binance Coin is sitting on the edge of a cliff; a little wriggling could see it tumble to $22.
- BNB positive on-chain activity on full throttle led by the daily active addresses.
Binance Coin made a shallow recovery from losses posted towards the end of September. Support embraced at $22 resulted in an upswing. Bulls regained control of the price to the extent, BNB/USD tested the hurdle at $30. However, a reversal came into the picture, leaving September highs around $34 untested. In the meantime, Binance Coin is teetering at $27.4 as bears stamp their feet down.
Binance Coin impending breakdown could revisit $22
Selling activities are lingering within the Binance Coin markets. The Relative Strength Index (RSI) is also on a downtrend. If the RSI slides under the midline and continues with the downward movement towards the oversold area, the possibility of selling orders surging will rise.
BNB’s lower leg is also on the verge of slicing through the 50 Simple Moving Average (SMA) in the 12-hour timeframe. Declines under this critical moving average could kick start a breakdown to the support at $22. The 100 SMA in the 12-hour timeframe is in line to absorb some of the selling pressure around $25.
BNB/USD 12-hour chart
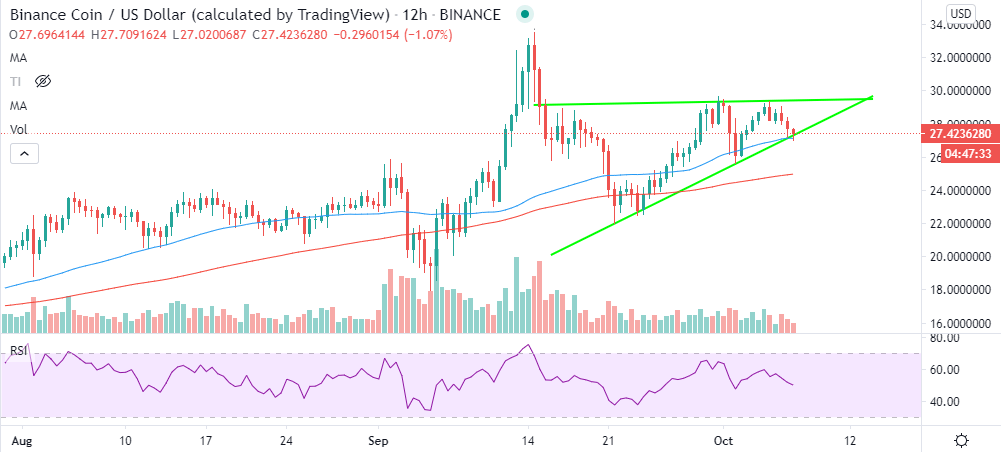
The bearish case is also highlighted by the ascending triangle pattern, formed by price actions that allow a horizontal line to be drawn above the swing highs while a rising trendline connects the swing lows. Traders lookout for breakouts, especially the ones that occur below the ascending trendline. In this case, BNB is likely to resume the downtrend, revisiting the $22 and $20 levels.
According to Santiment, BNB is showing bullish signs based on various on-chain metrics. The on-chain analytics platform highlights “a 40-day high in unique addresses transacting on its network.”
$BNB has shown its first sign of a bullish divergence since August after a 40-day high in unique addresses transacting on its network Tuesday. The 6th ranked #crypto asset is already off to a hot start through the first few hours of Wednesday as well. https://t.co/HArgHS3K0S pic.twitter.com/BSX7Vir4Vt
— Santiment (@santimentfeed) October 7, 2020
The holder distribution metric by Santiment also shows an increase in the whale’s activity. Addresses holding between 10,000 and 100,000 BNB have increased from 43 on October 4 to 45 on October 7. As these addresses grow, buying pressure is likely to rise. A surge in the buying pressure could continue with the rally back to $30.
BNB holder distribution chart
 [10.48.06, 07 Oct, 2020]-637376553229891938.png)
Simultaneously, an increase in daily active addresses over the last few days suggests that on-chain activity is booming within the network. At the time of writing, the addresses stand at 6,334, up from 4,722 on October 5. Further increase in the daily active addresses is likely to support a bullish narrative.
BNB daily active addresses chart
 [11.17.06, 07 Oct, 2020]-637376554401237971.png)
Looking at the other side of the picture
Binance Coin is giving mixed signals according to the above analysis. On-chain activity suggests a possible breakout. On the other hand, technical analysis hints towards an imminent breakdown. If the 50 SMA remains intact as the short-term support, buyers are likely to regain control based on the positive on-chain activity support.
Author

John Isige
FXStreet
John Isige is a seasoned cryptocurrency journalist and markets analyst committed to delivering high-quality, actionable insights tailored to traders, investors, and crypto enthusiasts. He enjoys deep dives into emerging Web3 tren


