• Binance Coin was set to break its downtrend since December, but price action has faded, and bears sprang a bull trap.
  • BNB sees bulls climbing out of the ditch after a positive open across the board in ASIA PAC and European indices.
  • BNB could hit $452 by the end of this week, bringing some 10% gains to portfolios.

Binance Coin (BNB) price action hurt quite a lot of bulls yesterday, after bears jumped on the break above the red descending trendline and, in the process, pulled BNB price to the downside, hitting bulls with a loss. Bulls had to cave in and take the loss but are back today as favourable tailwinds from equity markets are spilling over into cryptocurrencies. Expect more upside to come as investors are now ultimately looking beyond the messages from several central banks last week, and taking advantage of upside opportunities, with BNB price action set to hit $452 by the end of this week.   

When BNB hits $452, bulls have reached  a 10% gain, and the downtrend is dead and buried

Binance Coin looked very bullish yesterday as the price shot through the red descending trend line dictating price action since December. With that break, more bulls jumped in eagerly for a long position thinking this could be the prelude of a rally up towards new all-time highs. But bears pushed back, making  it a false break and trapping bulls in the process, who then got squeezed out of their positions at the break of $434.70. With a 6% loss on the books intraday, the Relative Strength Index had to halt its uptrend and saw a short bearish knee-jerk reaction. 

BNB price action is getting some help this morning from global indices as both the ASIA PAC and the European sessions are printing green numbers on all major stock indexes, and several hedge trades are starting to unwind. This has created a positive bullish sentiment that is creating tailwinds for several asset classes in global markets, among them cryptocurrencies. Critical for today is that BNB price action can break above the monthly pivot around $420 and possibly break the red descending trend line with a daily close above it again, to set the scene for $452 later this week.
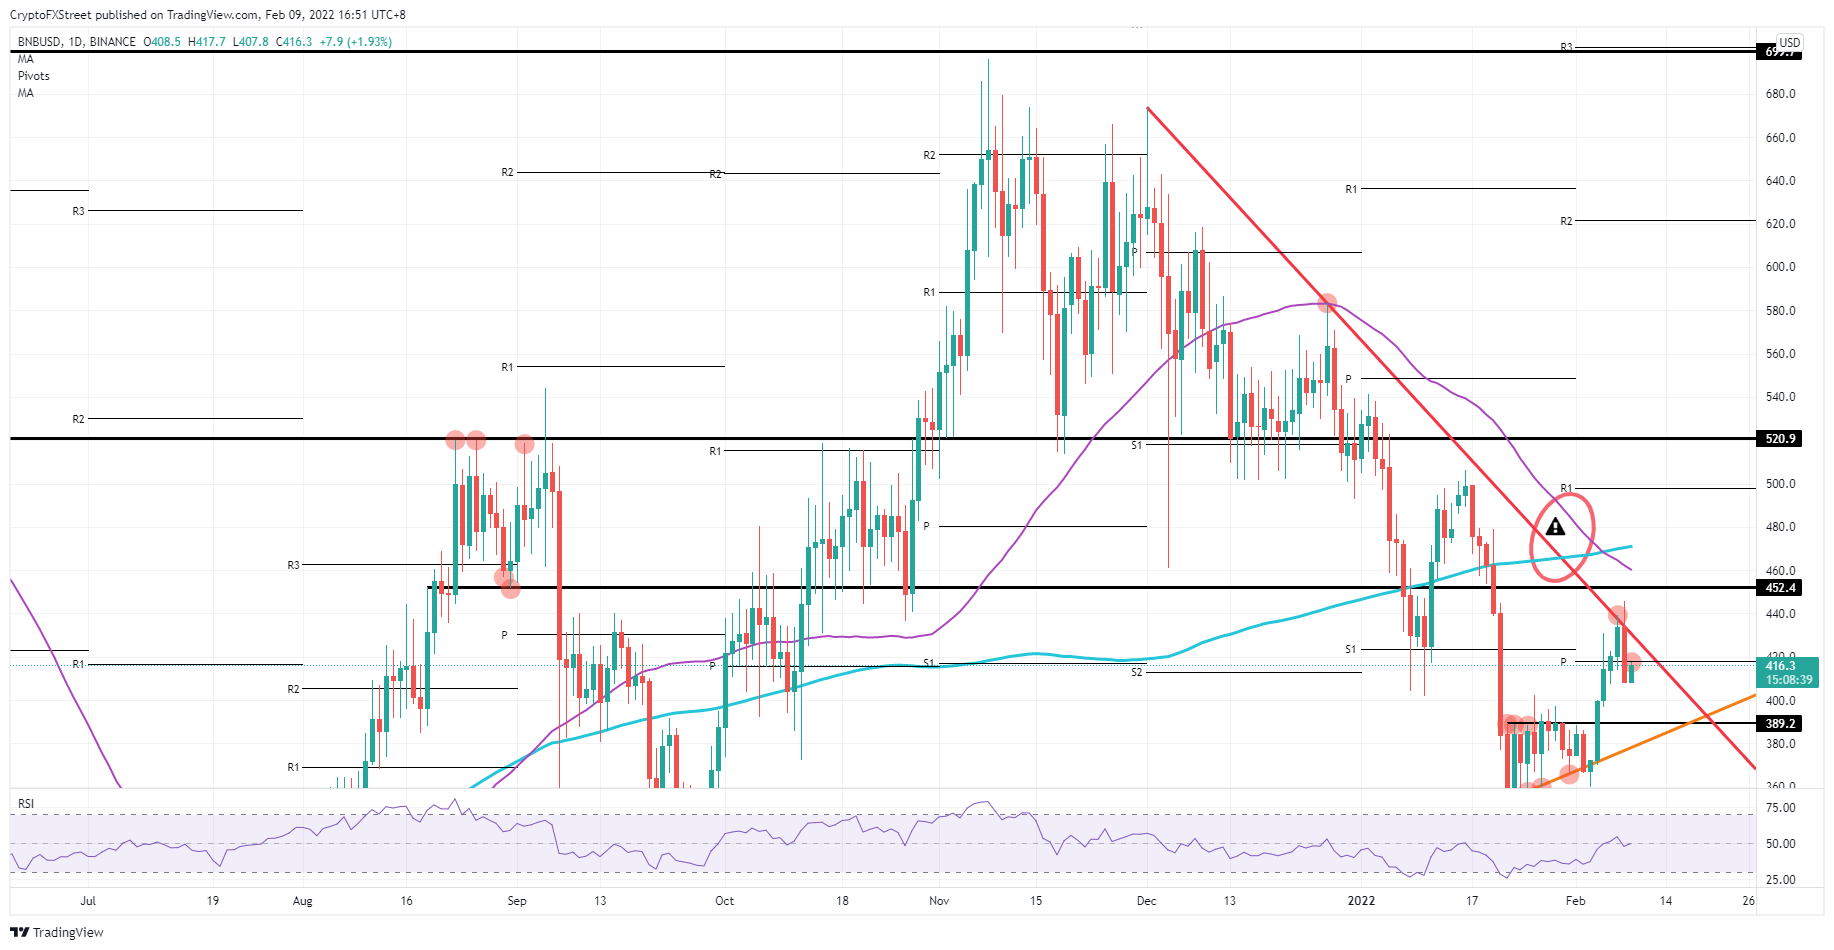
BNB/USD daily chart

BNB/USD daily chart

After the firm rejection on the false break, a possible rejection by the monthly pivot at $420 could be next. That would mean that the red descending trend line is just still too tough to break, and with the death cross – from the 55-day Simple Moving Average (SMA) trading below the 200-day SMA – we have two very bearish indicators capping any upside potential. Expect a search for support towards $389 with the short-term support level and the orange ascending trend line as underpinning elements keeping BNB price action from falling further.


Information on these pages contains forward-looking statements that involve risks and uncertainties. Markets and instruments profiled on this page are for informational purposes only and should not in any way come across as a recommendation to buy or sell in these assets. You should do your own thorough research before making any investment decisions. FXStreet does not in any way guarantee that this information is free from mistakes, errors, or material misstatements. It also does not guarantee that this information is of a timely nature. Investing in Open Markets involves a great deal of risk, including the loss of all or a portion of your investment, as well as emotional distress. All risks, losses and costs associated with investing, including total loss of principal, are your responsibility. The views and opinions expressed in this article are those of the authors and do not necessarily reflect the official policy or position of FXStreet nor its advertisers. The author will not be held responsible for information that is found at the end of links posted on this page.

If not otherwise explicitly mentioned in the body of the article, at the time of writing, the author has no position in any stock mentioned in this article and no business relationship with any company mentioned. The author has not received compensation for writing this article, other than from FXStreet.

FXStreet and the author do not provide personalized recommendations. The author makes no representations as to the accuracy, completeness, or suitability of this information. FXStreet and the author will not be liable for any errors, omissions or any losses, injuries or damages arising from this information and its display or use. Errors and omissions excepted.

The author and FXStreet are not registered investment advisors and nothing in this article is intended to be investment advice.

Join Telegram

Recommended content


Recommended Content

Editors’ Picks

Ripple on-chain metrics show bullish signs amidst legal struggle with SEC, XRP eyes recovery

Ripple on-chain metrics show bullish signs amidst legal struggle with SEC, XRP eyes recovery

Ripple made a comeback above $0.48 on Tuesday and hovers above that level in Wednesday’s European session. Ripple on-chain metrics such as transaction volume and Network Realized Profit/Loss have turned bullish, supporting a recovery in the altcoin. 

More Ripple News

Bitcoin price falls amidst German government transfers, miners activity

Bitcoin price falls amidst German government transfers, miners activity

Bitcoin (BTC) extends correction on Wednesday and hovers around $61,000 after finding resistance near the $64,000 level on Monday. Recent on-chain data indicates heightened selling activity from Bitcoin miners early in the week. 

More Bitcoin News

Crypto Today: Bitcoin erases gains from end of June, Ethereum declines while Ripple holds

Crypto Today: Bitcoin erases gains from end of June, Ethereum declines while Ripple holds

Bitcoin wipes out gains from the last week of June and falls below $60,000 on Wednesday. Ethereum and top altcoins ranked by market capitalization erased gains as the inflation outlook worsened. Ripple holds on to recent gains and hovers above $0.48 on Wednesday. 

More Cryptocurrencies News

Three reasons why altcoins could shake off losses this week

Three reasons why altcoins could shake off losses this week

On-chain data from Santiment shows that altcoins are currently in the opportunity zone, or generating buy signals. The top three altcoins in the buy zone are Basic Attention Token (BAT), Chromia (CHR), and Highstreet (HIGH), per Santiment. 

More Altcoins News

Bitcoin: BTC price correction could end in July, according to seasonal data

Bitcoin: BTC price correction could end in July, according to seasonal data

Bitcoin (BTC) price appears poised for a decline this week, influenced by slight outflows in US spot ETFs, selling activity among BTC miners, and a combined transfer of 4,690.28 BTC to centralized exchanges by the US and German governments.

Read full analysis

BTC

ETH

XRP