![]() Lorenzo Stroe
Lorenzo Stroe
Independent Analyst
- BNB is currently trading at $30.37 after several days of sideways price action.
- Binance conducted the 13th quarterly burn, burning a total of 2,253,888 BNB, the highest ever in fiat terms.
Binance Coin was initial launched as an ERC-20 token before getting its own mainnet. The exchange started burning coins in October 2017 starting with only 986,000 coins. Since then, Binance has completed quarterly coin burns reducing the total supply of BNB by more than 10%.
BNB eying up $33.34
The first few BNB burns had a stronger immediate effect on the price of BNB, however, the more recent ones haven’t pushed the price of the digital asset directly. They are now viewed as a more long-term bullish indicator without pumping the value of the digital asset.
BNB/USD daily chart
-637387211954316904.png)
Nonetheless, massive burns like the last one have a huge positive impact in the long-term. The price of BNB is currently way above the 50-SMA, 100-SMA, and 200-SMA. There are two clear resistance levels on the way up, the most recent one was established at $31.35 and the next is $33.34, the 2020-high.
BNB Age Consumed Chart
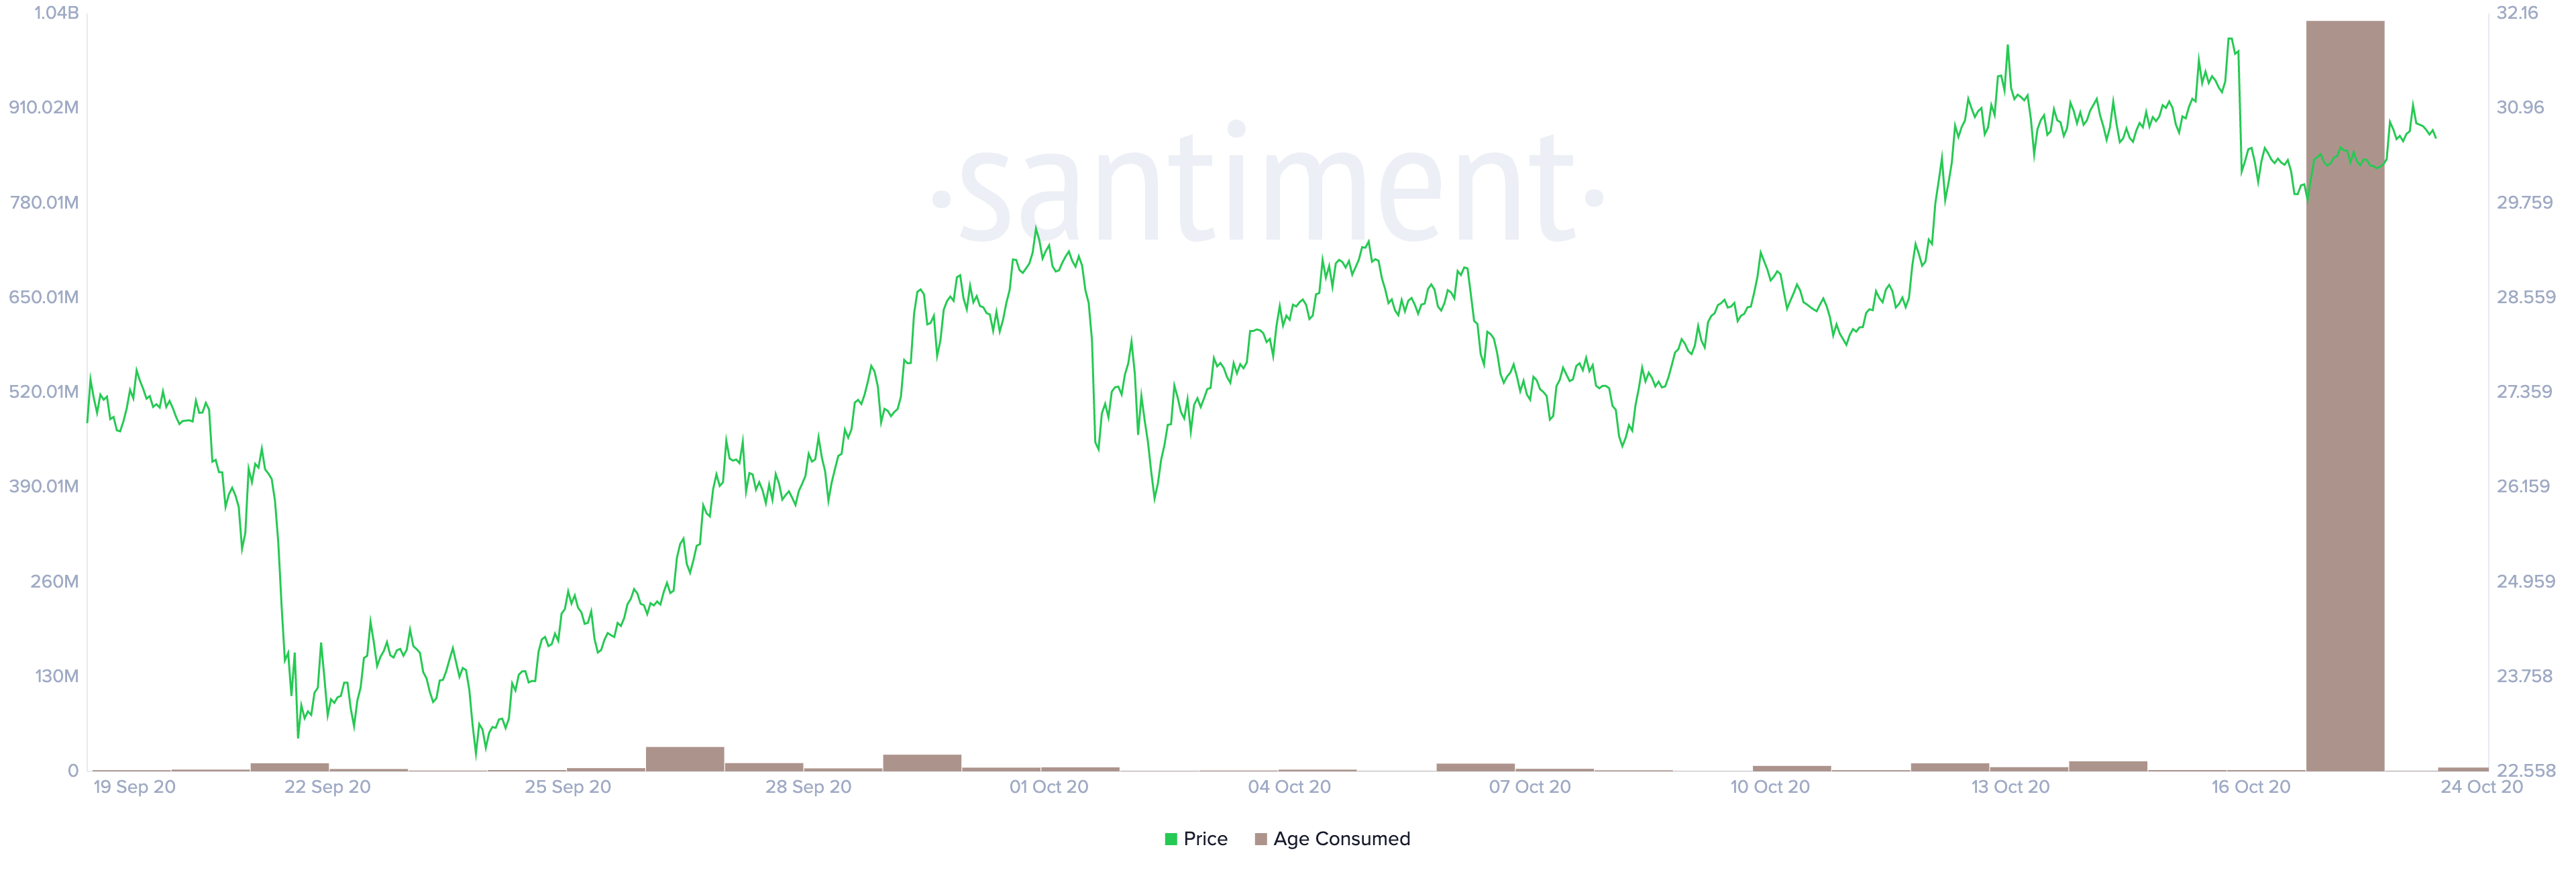
Santiment shows a massive spike in the age consumed of BNB, related to the burn of BNB, but not entirely just from that. This metric shows the number of tokens changing addresses keeping in mind the last time they moved. A large spike like the one currently usually indicates that a lot of tokens are moving after being idle for quite some time.
Considering the trading volume seems to be dropping on Binance, we could be on the verge of a massive price move. As long as the bulls can push BNB above $31.35, the digital asset can easily reach the 2020-high at $33.34 and potentially run higher.
BNB/USD 12-hour chart
-637387212042135931.png)
On the other hand, it seems that the 12-hour chart is shifting in favor of the bears. BNB established a weak higher high at $31.97 compared to $31.79 followed by a lower high at $31.03. Bears are now trying to push the price below $29.57 to form a lower low and confirm a downtrend.
Additionally, the MACD flipped bearish on October 16 and it’s gaining strength. The next potential price target for the bears if $29.57 is broken would be $28.5 where the 100-SMA is currently established. The 50-SMA at $26.82, which coincides with a support level would be the next price target.
Key price points to look for
The recent BNB burn is a huge positive long-term indicator as Binance has burned more than 10% of the total supply of the digital asset. Bulls are facing one critical resistance level at $31.35. If broken, BNB can easily reach $33.34 and potentially run higher.
On the flip side, it seems that bears are taking control of the 12-hour chart. The MACD is bearish and a breakout below $29.57 would most likely drive the price of BNB down to $28.5 and as low as $26.82, a strong support level.
Note: All information on this page is subject to change. The use of this website constitutes acceptance of our user agreement. Please read our privacy policy and legal disclaimer. Opinions expressed at FXstreet.com are those of the individual authors and do not necessarily represent the opinion of FXstreet.com or its management. Risk Disclosure: Trading foreign exchange on margin carries a high level of risk, and may not be suitable for all investors. The high degree of leverage can work against you as well as for you. Before deciding to invest in foreign exchange you should carefully consider your investment objectives, level of experience, and risk appetite. The possibility exists that you could sustain a loss of some or all of your initial investment and therefore you should not invest money that you cannot afford to lose. You should be aware of all the risks associated with foreign exchange trading, and seek advice from an independent financial advisor if you have any doubts.
Recommended Content
Editors’ Picks

Crypto fraud soars as high-risk addresses on Ethereum, TRON networks receive $278 billion
The cryptocurrency industry is growing across multiple facets, including tokenized real-world assets, futures and spot ETFs, stablecoins, Artificial Intelligence (AI), and its convergence with blockchain technology, as well as the dynamic decentralized finance (DeFi) sector.

Bitcoin eyes $100,000 amid Arizona Reserve plans, corporate demand, ETF inflows
Bitcoin price is stabilizing around $95,000 at the time of writing on Tuesday, and a breakout suggests a rally toward $100,000. The institutional and corporate demand supports a bullish thesis, as US spot ETFs recorded an inflow of $591.29 million on Monday, continuing the trend since April 17.

Meme coins to watch as Bitcoin price steadies
Bitcoin price hovers around $95,000, supported by continued spot BTC ETFs’ inflows. Trump Official is a key meme coin to watch ahead of a stakeholder dinner to be attended by President Donald Trump. Dogwifhat price is up 47% in April and looks set to post its first positive monthly returns this year.

Cardano Lace Wallet integrates Bitcoin, boosting cross-chain capabilities
Cardano co-founder Charles Hoskinson announced Monday that Bitcoin is integrated into the Lace Wallet, expanding Cardano’s ecosystem and cross-chain capabilities. This integration enables users to manage BTC alongside Cardano assets, providing support for multichain functionality.
Bitcoin Weekly Forecast: BTC consolidates after posting over 10% weekly surge
Bitcoin (BTC) price is consolidating around $94,000 at the time of writing on Friday, holding onto the recent 10% increase seen earlier this week.

The Best brokers to trade EUR/USD
SPONSORED Discover the top brokers for trading EUR/USD in 2025. Our list features brokers with competitive spreads, fast execution, and powerful platforms. Whether you're a beginner or an expert, find the right partner to navigate the dynamic Forex market.