- Several indicators are showing that BNB could be on its way to a retracement.
- BNB is currently trading at $27.1 after a strong rebound from $22.
BNB outperformed the market during September jumping to $33 after several positive announcements from Binance. The rally didn’t last too long, and the digital asset quickly fell to previous trading prices.
Is the hype of BNB coming to a pause?
The last major correction started on September 14 and took BNB price down from $33.3 to $24.4. Bulls were able to push the price back up to a current high of $26.8, climbing above the 12-hour 50-MA and 100-MA.
BNB/USD 12-hour chart
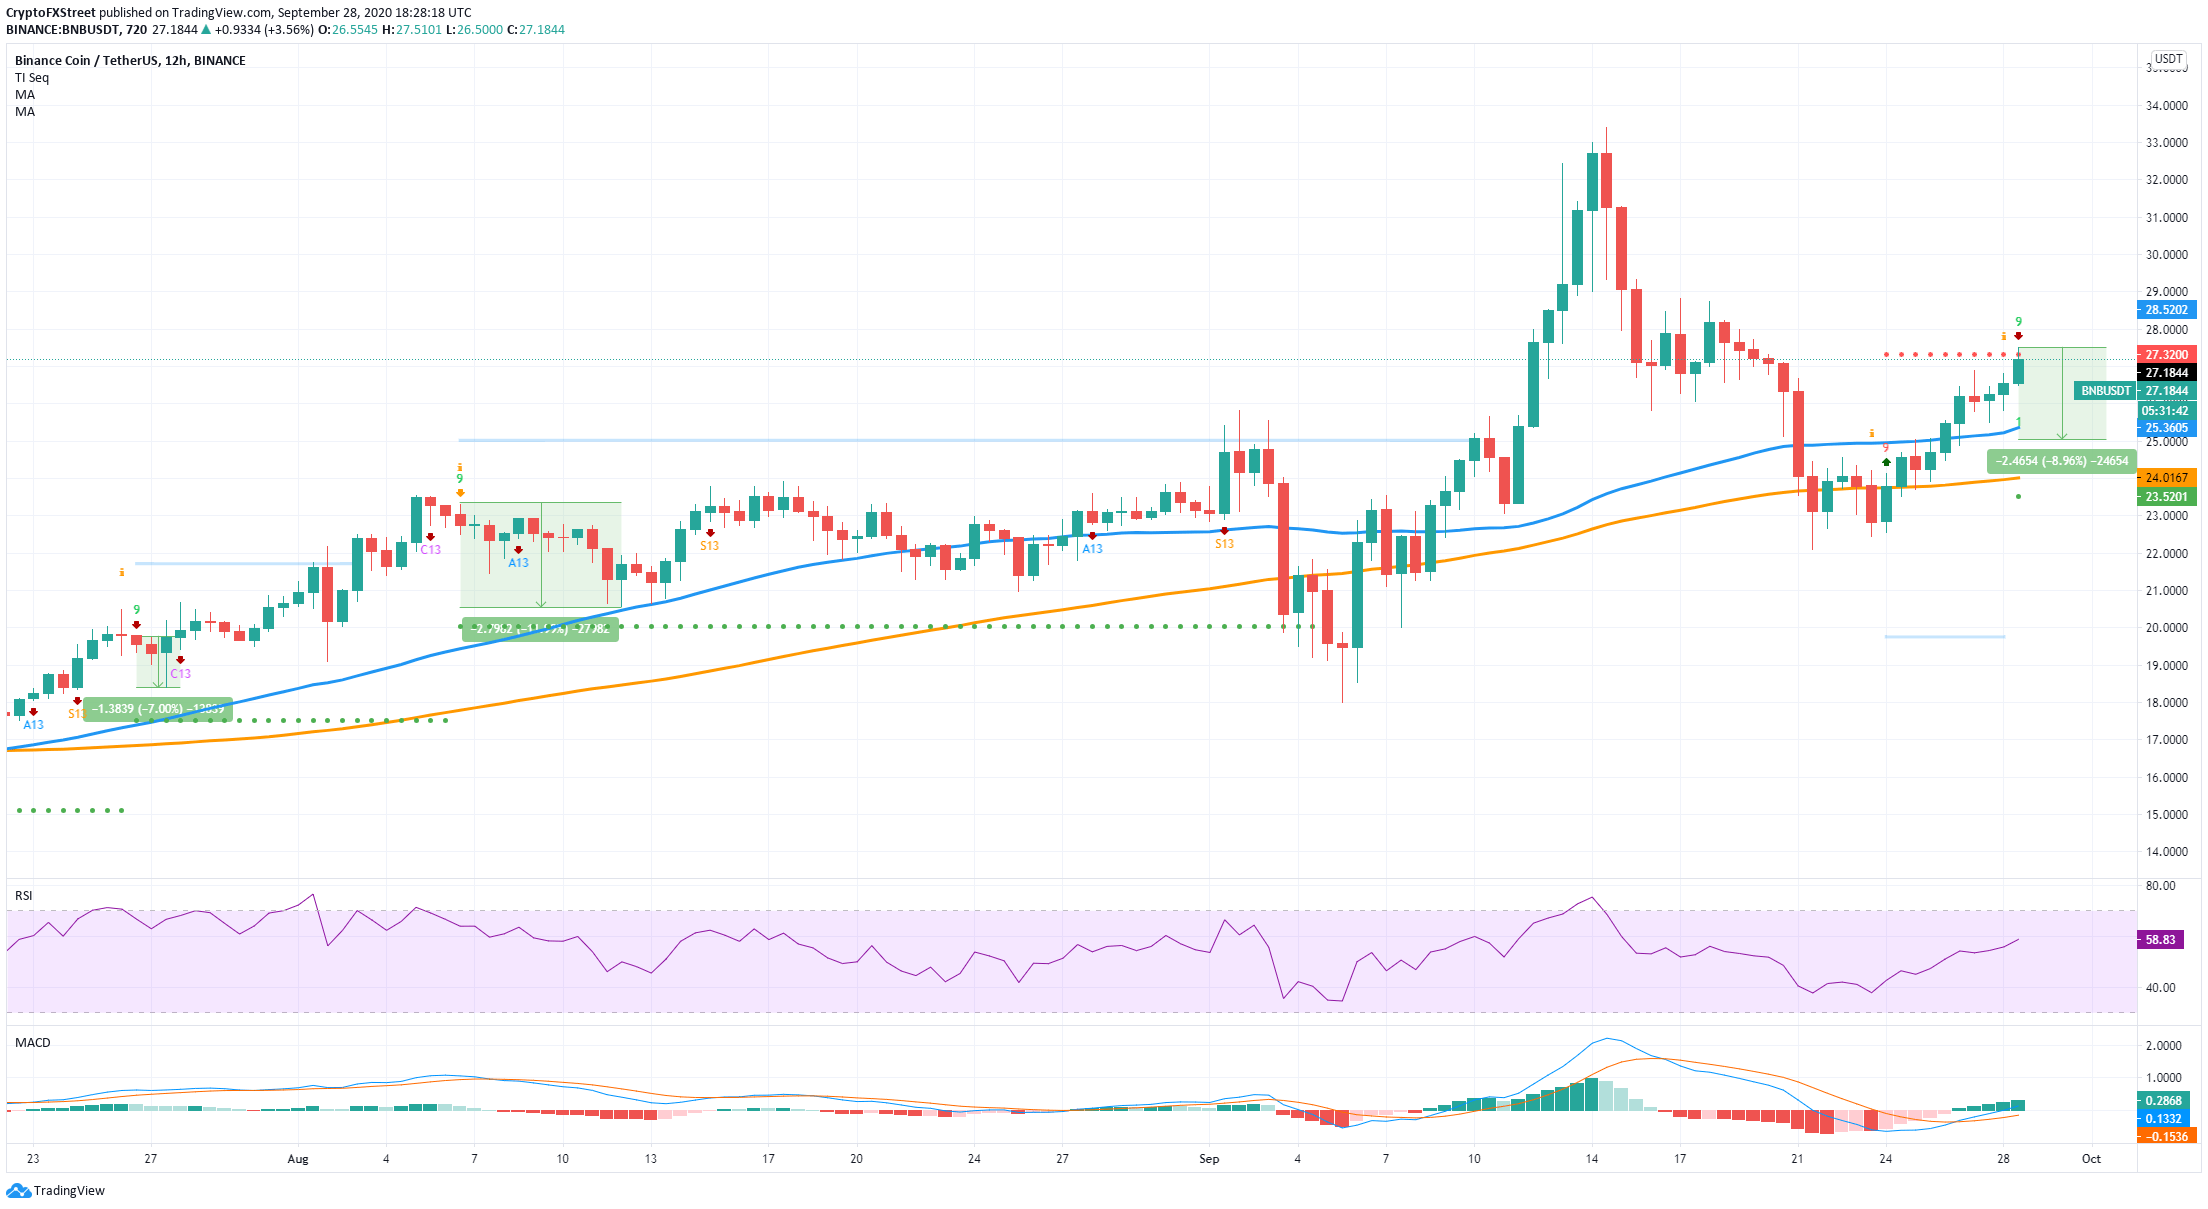
On the 12-hour chart, the TD sequential indicator has presented a sell signal. The last two signals on this time frame were both validated and dropped the price of BNB by an average of 9%. A similar dip would take BNB to $25, just below the 50-MA at $25.3 currently.
BNB/USD 4-hour chart
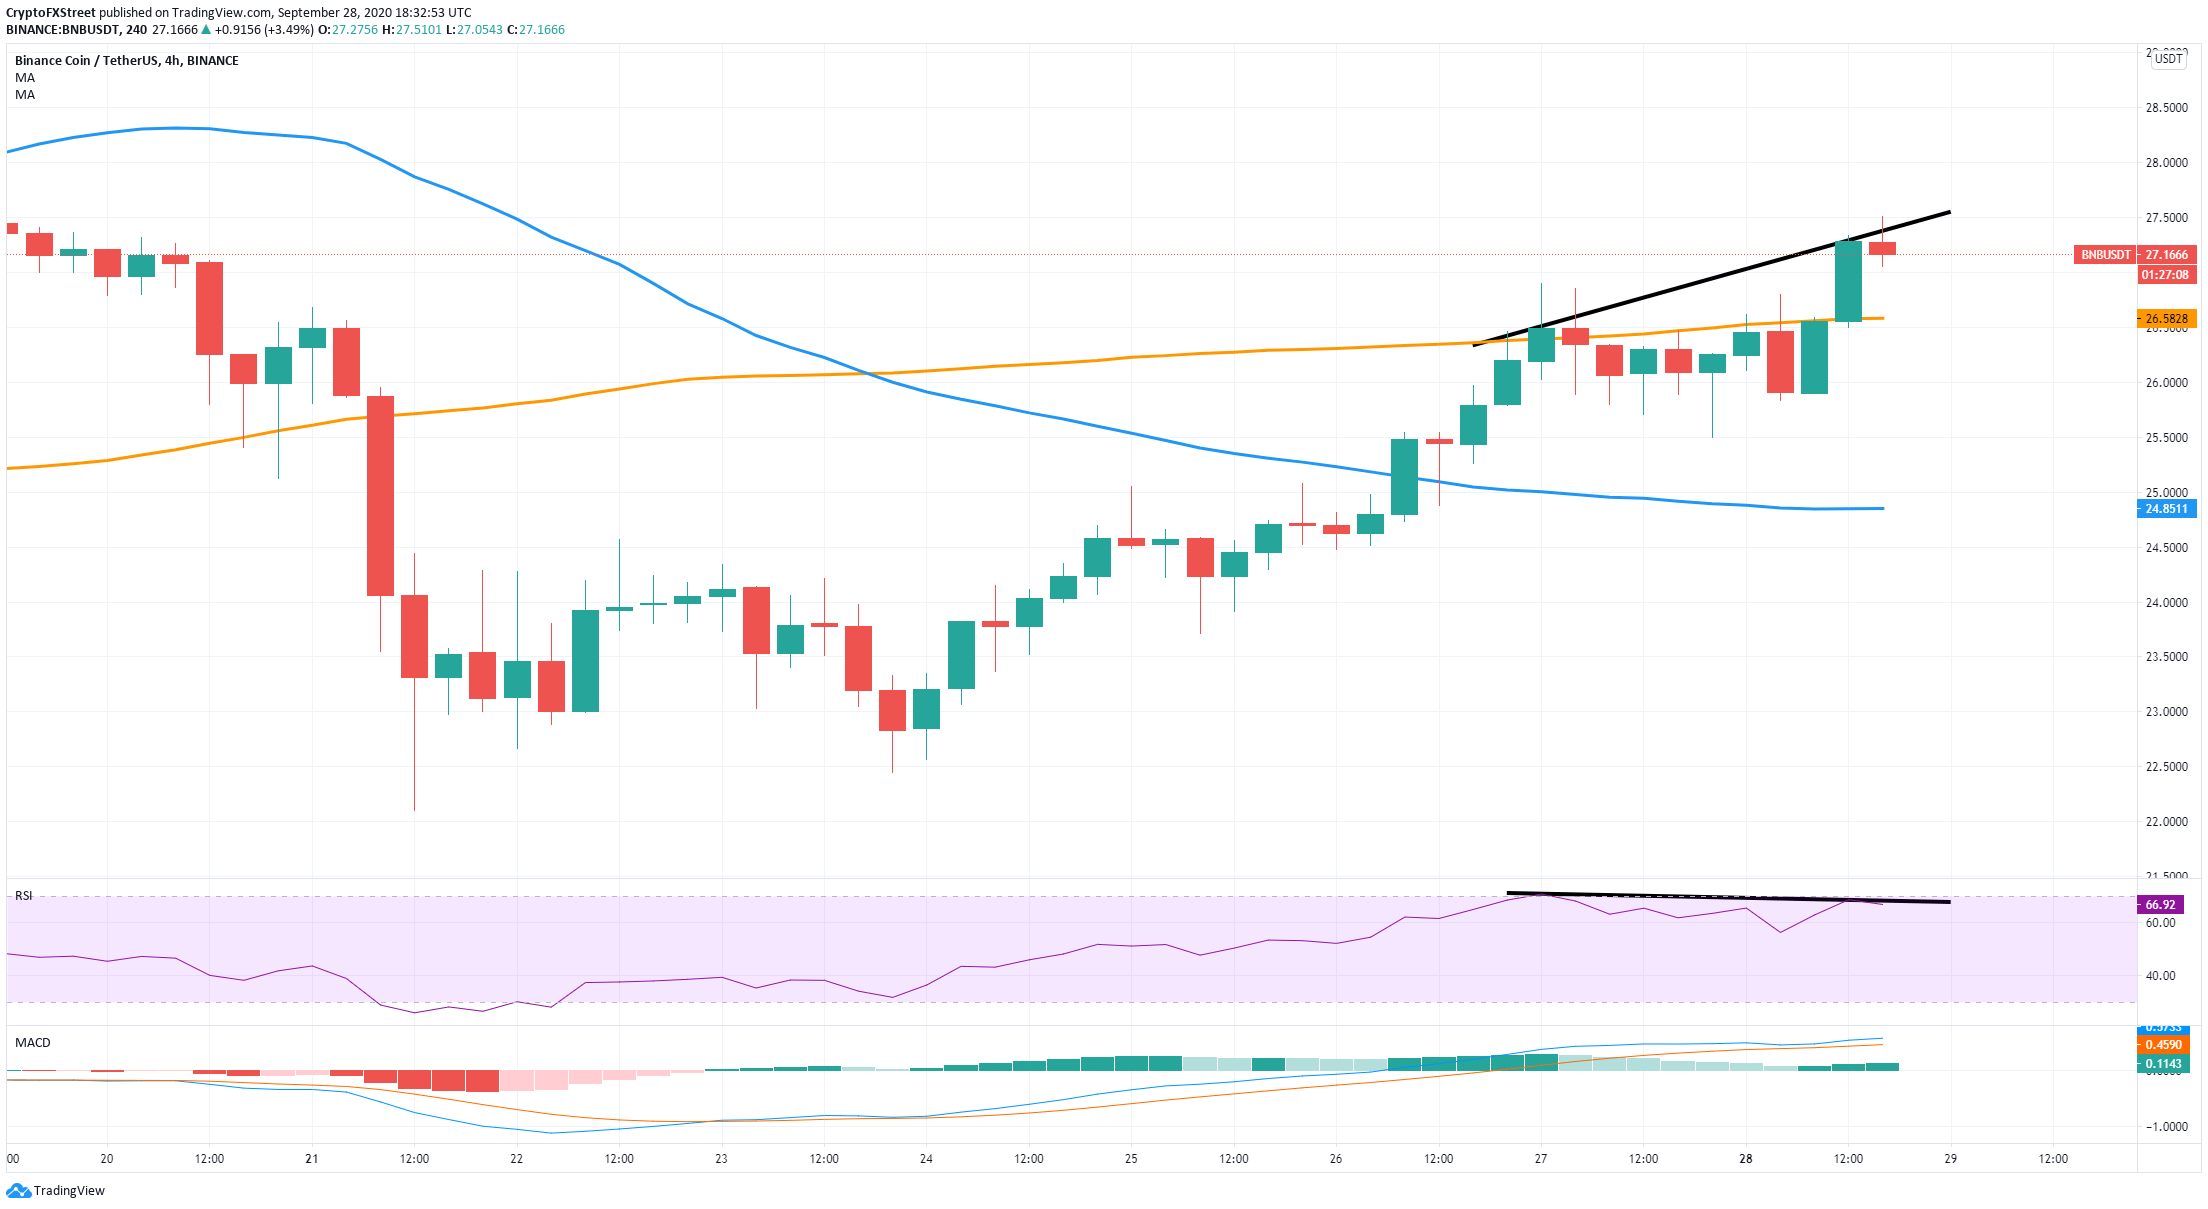
The native coin of Binance seems to have created a bearish divergence between its price and the RSI. This happens when the uptrend of the price doesn’t match the trend of the RSI. It usually means that momentum is slowing down, and the price is likely to see a rapid decline in the short-term.
BNB Holders Distribution Chart
The chart presented by Santiment seems to prove our theory further. The number of holders between 100,000 and 1,000,000 BNB coins and between 1,000,000 and 10,000,000 has increased since August 11. However, the number of whales has stopped growing since September 14. This metric is showing a lack of interest in the digital asset in the past two weeks.
BNB/USD daily chart
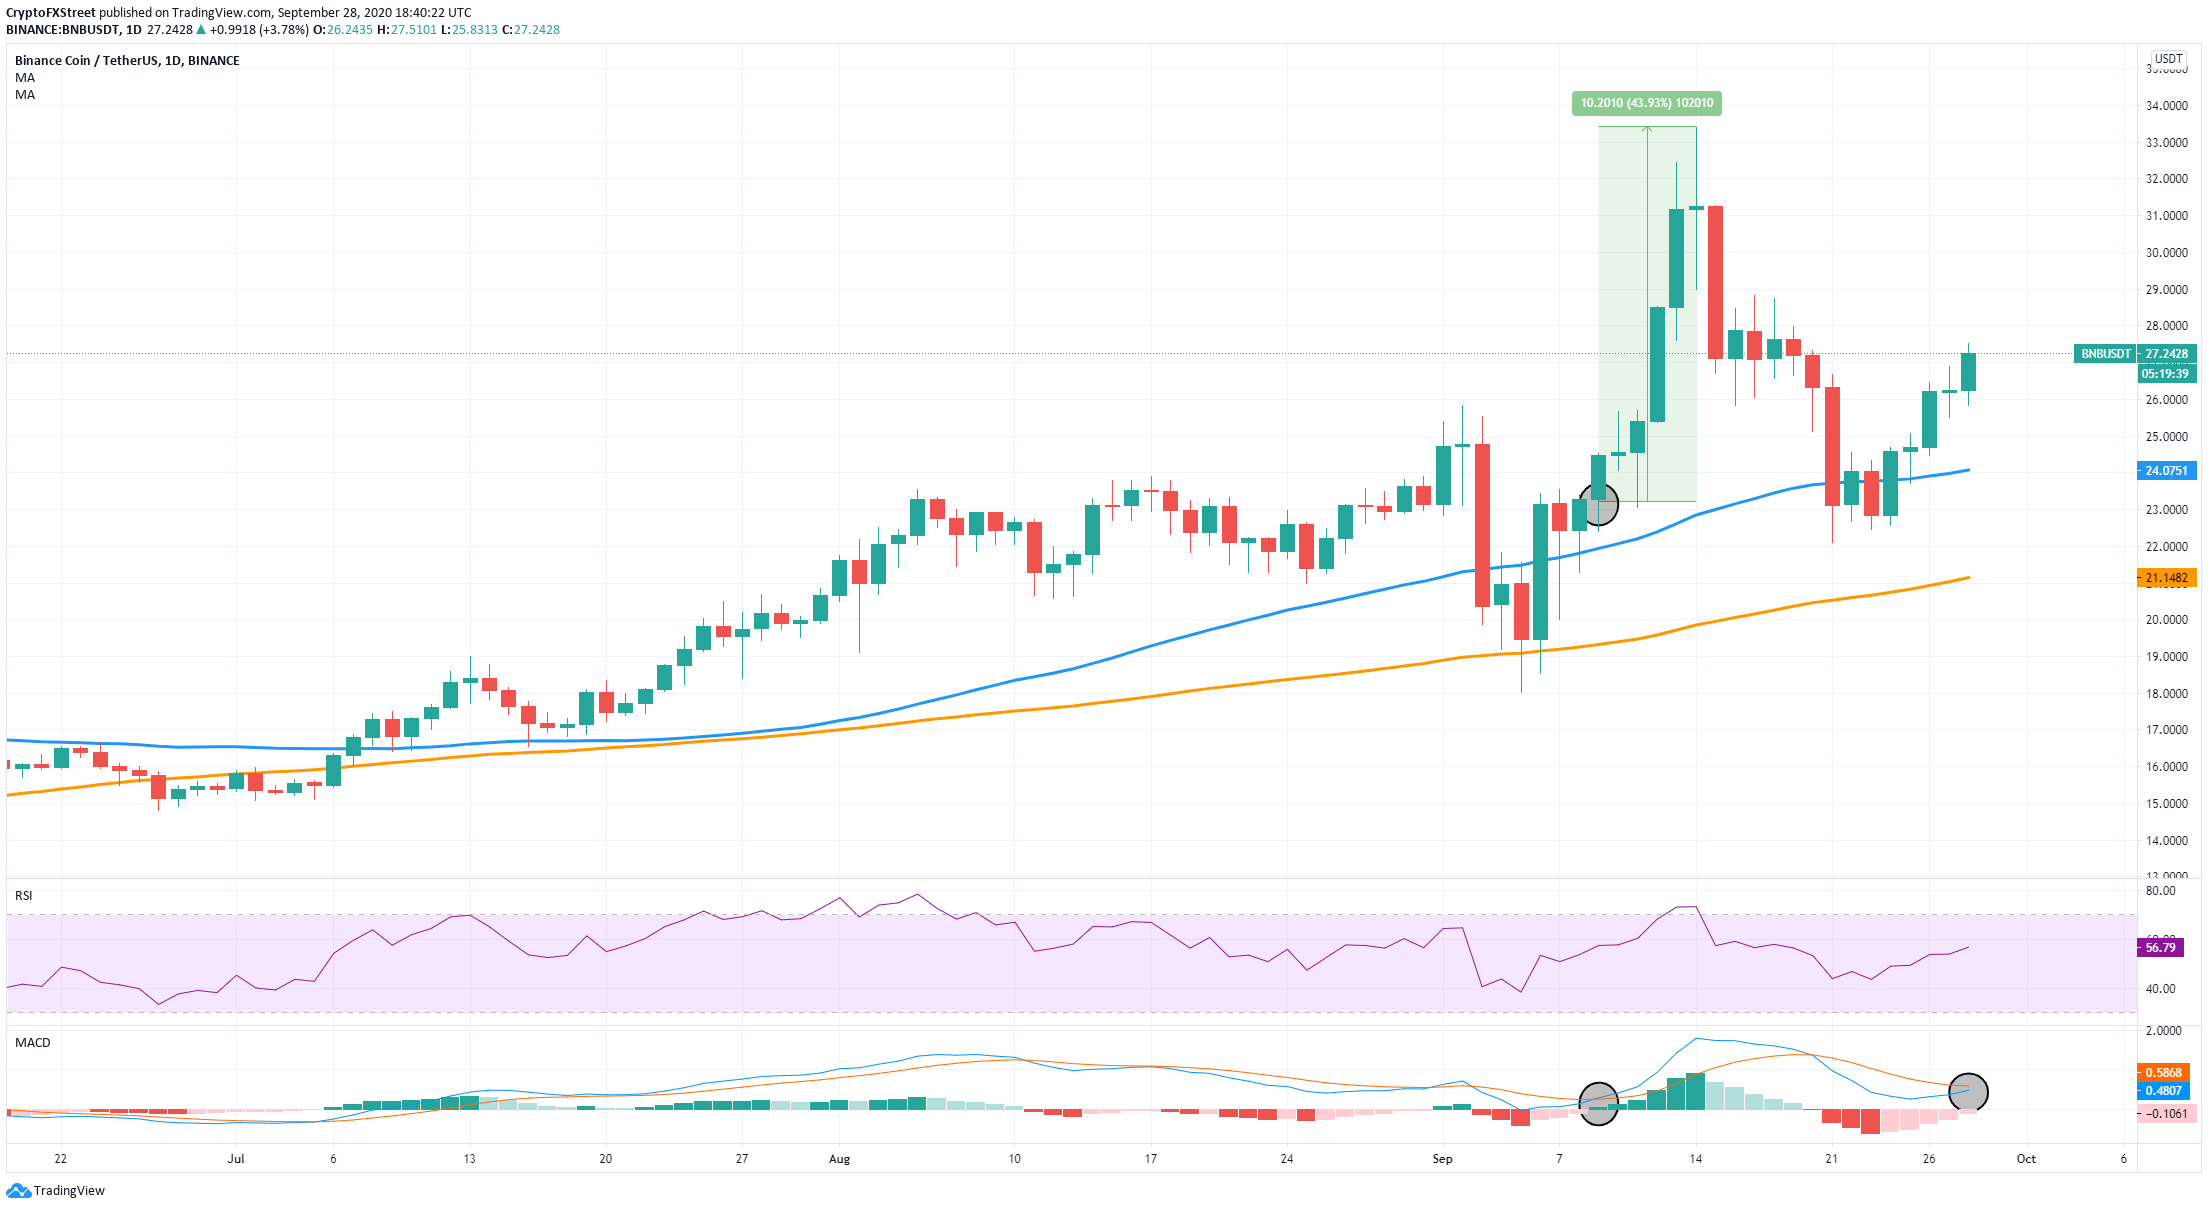
Although the shorter time-frames show a bearish outlook for BNB, zooming out to the daily chart can give us a better perspective of the price action. The MACD is on the verge of turning bullish, and the price of BNB is trading above the 50-MA. The last time the MACD crossed positively, BNB rallied up by 44%.
Note: All information on this page is subject to change. The use of this website constitutes acceptance of our user agreement. Please read our privacy policy and legal disclaimer. Opinions expressed at FXstreet.com are those of the individual authors and do not necessarily represent the opinion of FXstreet.com or its management. Risk Disclosure: Trading foreign exchange on margin carries a high level of risk, and may not be suitable for all investors. The high degree of leverage can work against you as well as for you. Before deciding to invest in foreign exchange you should carefully consider your investment objectives, level of experience, and risk appetite. The possibility exists that you could sustain a loss of some or all of your initial investment and therefore you should not invest money that you cannot afford to lose. You should be aware of all the risks associated with foreign exchange trading, and seek advice from an independent financial advisor if you have any doubts.
Recommended Content
Editors’ Picks
Ripple on-chain metrics show bullish signs amidst legal struggle with SEC, XRP eyes recovery
![Ripple on-chain metrics show bullish signs amidst legal struggle with SEC, XRP eyes recovery](https://editorial.fxstreet.com/images/Markets/Currencies/Cryptocurrencies/Coins/Ripple/Ripple_Coin_31_02_XtraSmall.jpg)
Ripple made a comeback above $0.48 on Tuesday and hovers above that level in Wednesday’s European session. Ripple on-chain metrics such as transaction volume and Network Realized Profit/Loss have turned bullish, supporting a recovery in the altcoin.
Bitcoin price falls amidst German government transfers, miners activity
![Bitcoin price falls amidst German government transfers, miners activity](https://editorial.fxstreet.com/images/Markets/Currencies/Digital%20Currencies/Bitcoin/bit-coin-symbol-flag-3d-illustration-59931110_XtraSmall.jpg)
Bitcoin (BTC) extends correction on Wednesday and hovers around $61,000 after finding resistance near the $64,000 level on Monday. Recent on-chain data indicates heightened selling activity from Bitcoin miners early in the week.
Crypto Today: Bitcoin erases gains from end of June, Ethereum declines while Ripple holds
![Crypto Today: Bitcoin erases gains from end of June, Ethereum declines while Ripple holds](https://editorial.fxstreet.com/images/Markets/Currencies/Digital%20Currencies/Bitcoin/Bitcoin_2_XtraSmall.jpg)
Bitcoin wipes out gains from the last week of June and falls below $60,000 on Wednesday. Ethereum and top altcoins ranked by market capitalization erased gains as the inflation outlook worsened. Ripple holds on to recent gains and hovers above $0.48 on Wednesday.
Three reasons why altcoins could shake off losses this week
![Three reasons why altcoins could shake off losses this week](https://editorial.fxstreet.com/images/Markets/Currencies/Cryptocurrencies/cryptos_XtraSmall.jpg)
On-chain data from Santiment shows that altcoins are currently in the opportunity zone, or generating buy signals. The top three altcoins in the buy zone are Basic Attention Token (BAT), Chromia (CHR), and Highstreet (HIGH), per Santiment.
Bitcoin: BTC price correction could end in July, according to seasonal data
![Bitcoin: BTC price correction could end in July, according to seasonal data](https://editorial.fxstreet.com/images/Markets/Currencies/Digital%20Currencies/Bitcoin/bitcoin_5_XtraSmall.jpg)
Bitcoin (BTC) price appears poised for a decline this week, influenced by slight outflows in US spot ETFs, selling activity among BTC miners, and a combined transfer of 4,690.28 BTC to centralized exchanges by the US and German governments.