Beyond Dogecoin: The five hottest cryptocurrencies on Twitter this month

In the realm of digital assets, Crypto Twitter is a major seat of power. Memecoins and serious large-cap assets alike can see their value rise or fall depending on whether the whimsical Twitter crowd decides to pay attention.
Huge rallies and dramatic declines often trigger waves of fear, uncertainty and doubt (FUD) or fear of missing out (FOMO) on the platform, capable of massively amplifying the unfolding price dynamics.
Granted, it would be convenient if increases in Twitter volume always spelled price hikes — yet, as the facts demonstrate, this relationship is way, way more complicated than that.
Tweet volume is one of the ingredients of a proprietary formula powering the VORTECS™ Score, a machine learning algorithm that compares historic and current market conditions around digital assets to aid crypto traders’ decision-making. The model considers a host of other indicators — including market outlook, price movement, social sentiment and trading activity — to arrive at a score that assesses whether the present conditions are historically bullish, neutral or bearish for a given coin.
This week, we follow five digital assets that made the biggest strides in terms of Twitter activity this month. All five saw their tweet volumes increase by hundreds of percentage points compared with the previous month’s average — but how actionable were these dynamics for traders?
Here’s how the VORTECS™ Score could give investors a few hints.
Telcoin (TEL): +300% Twitter volume
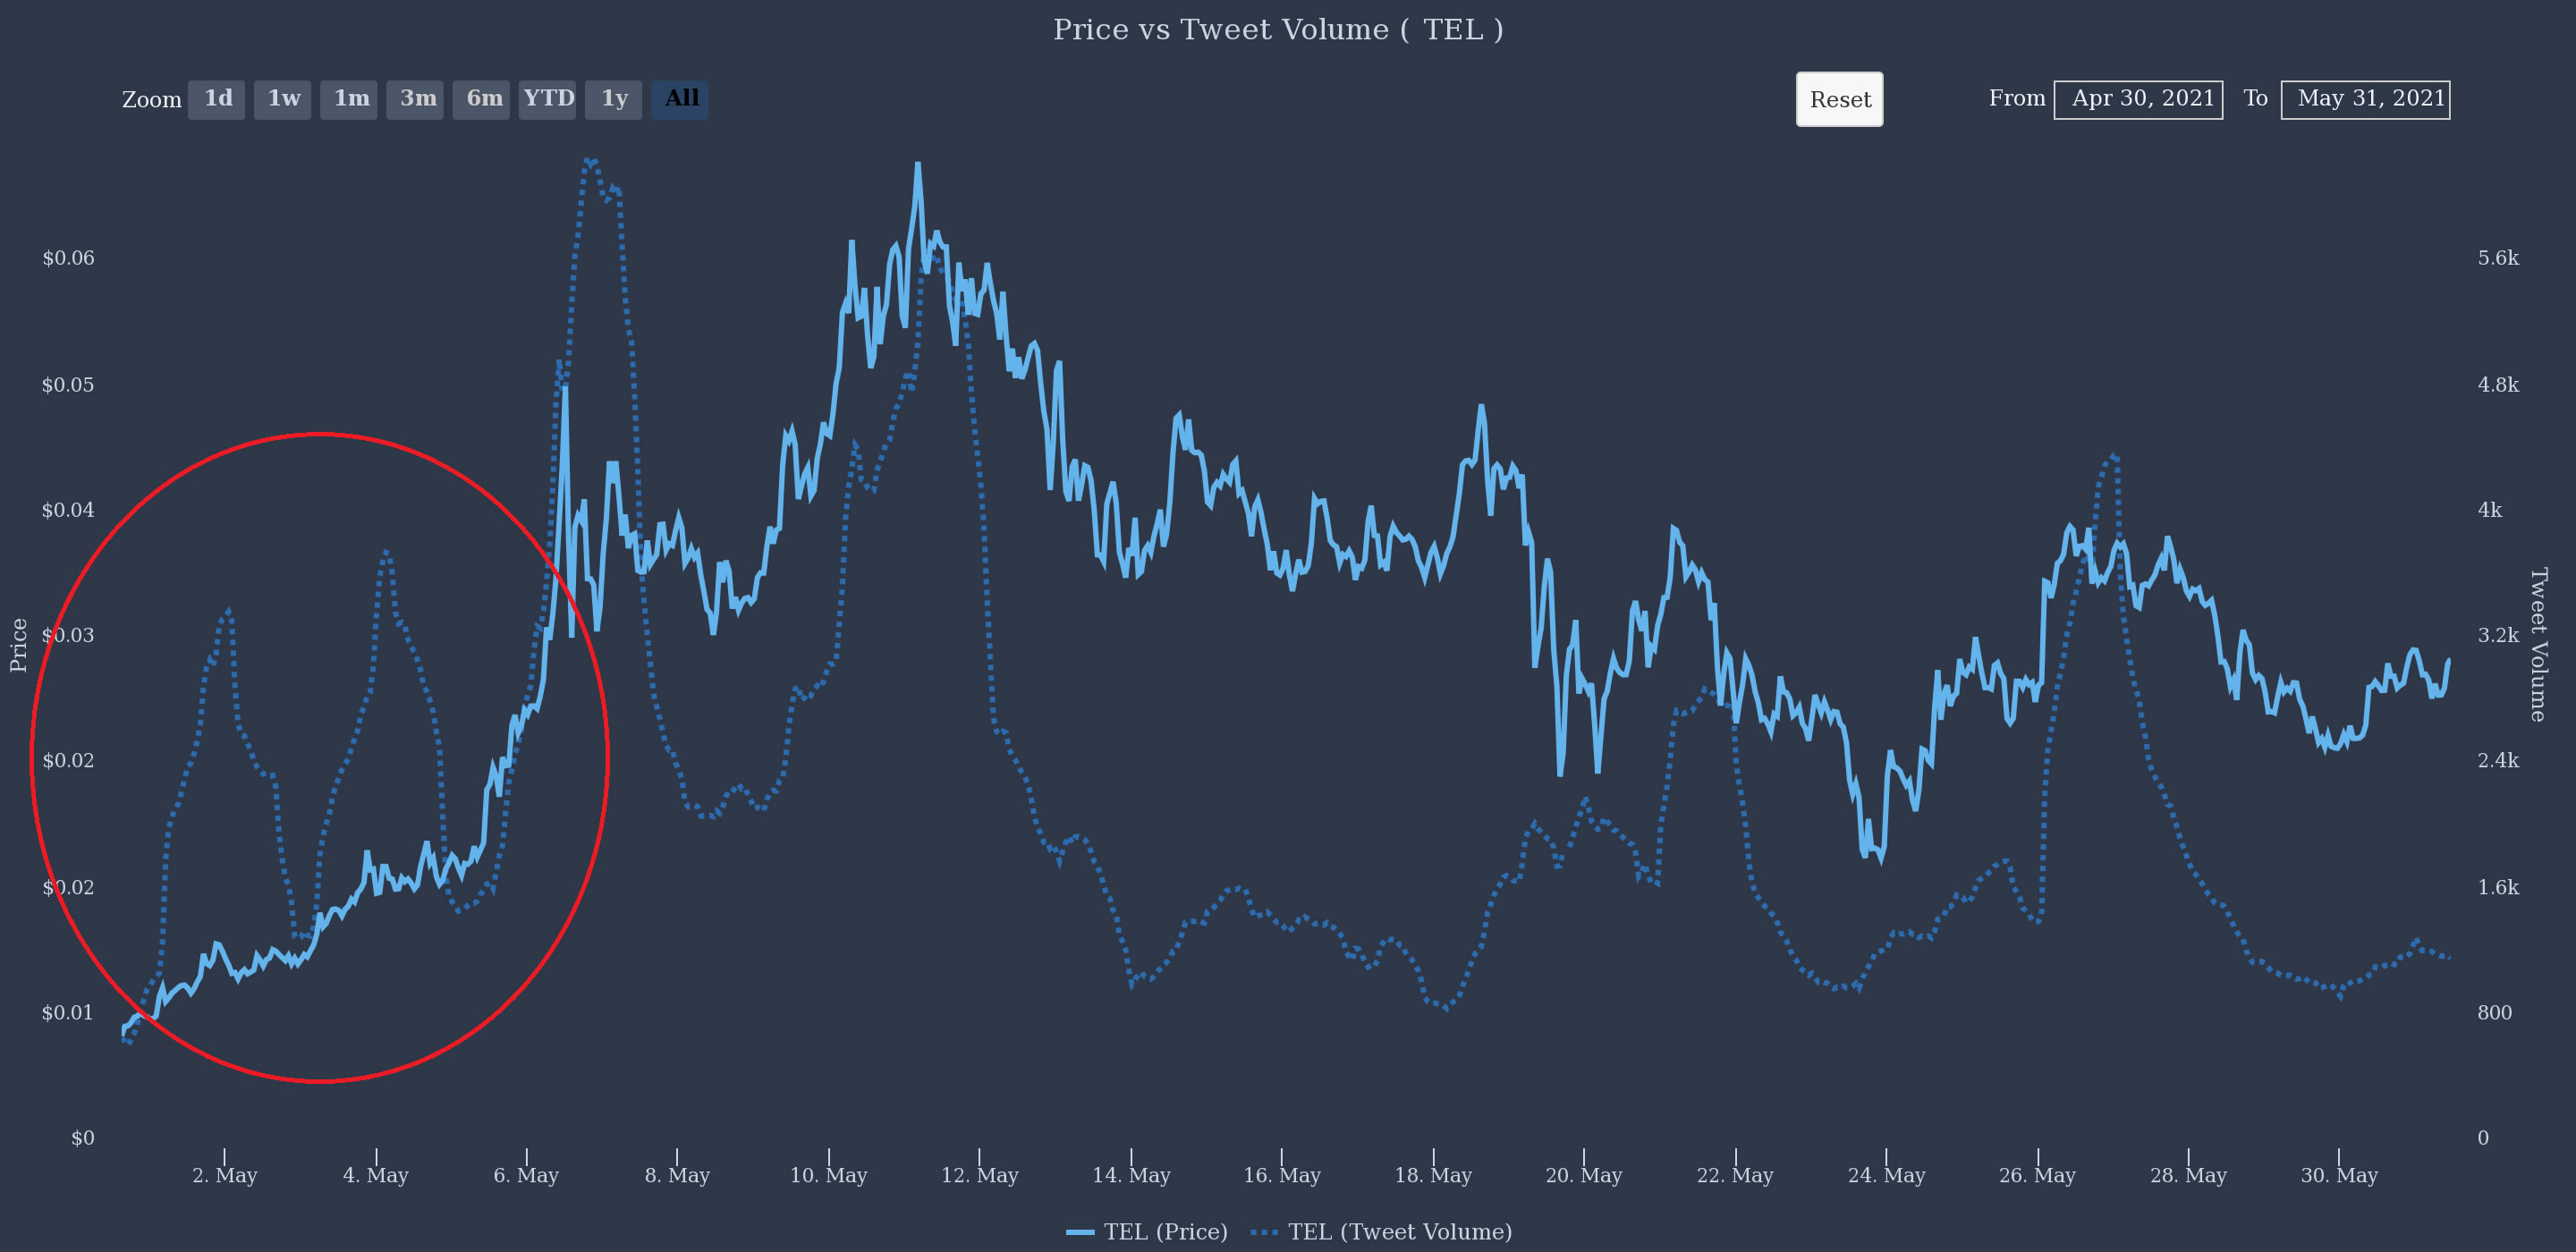
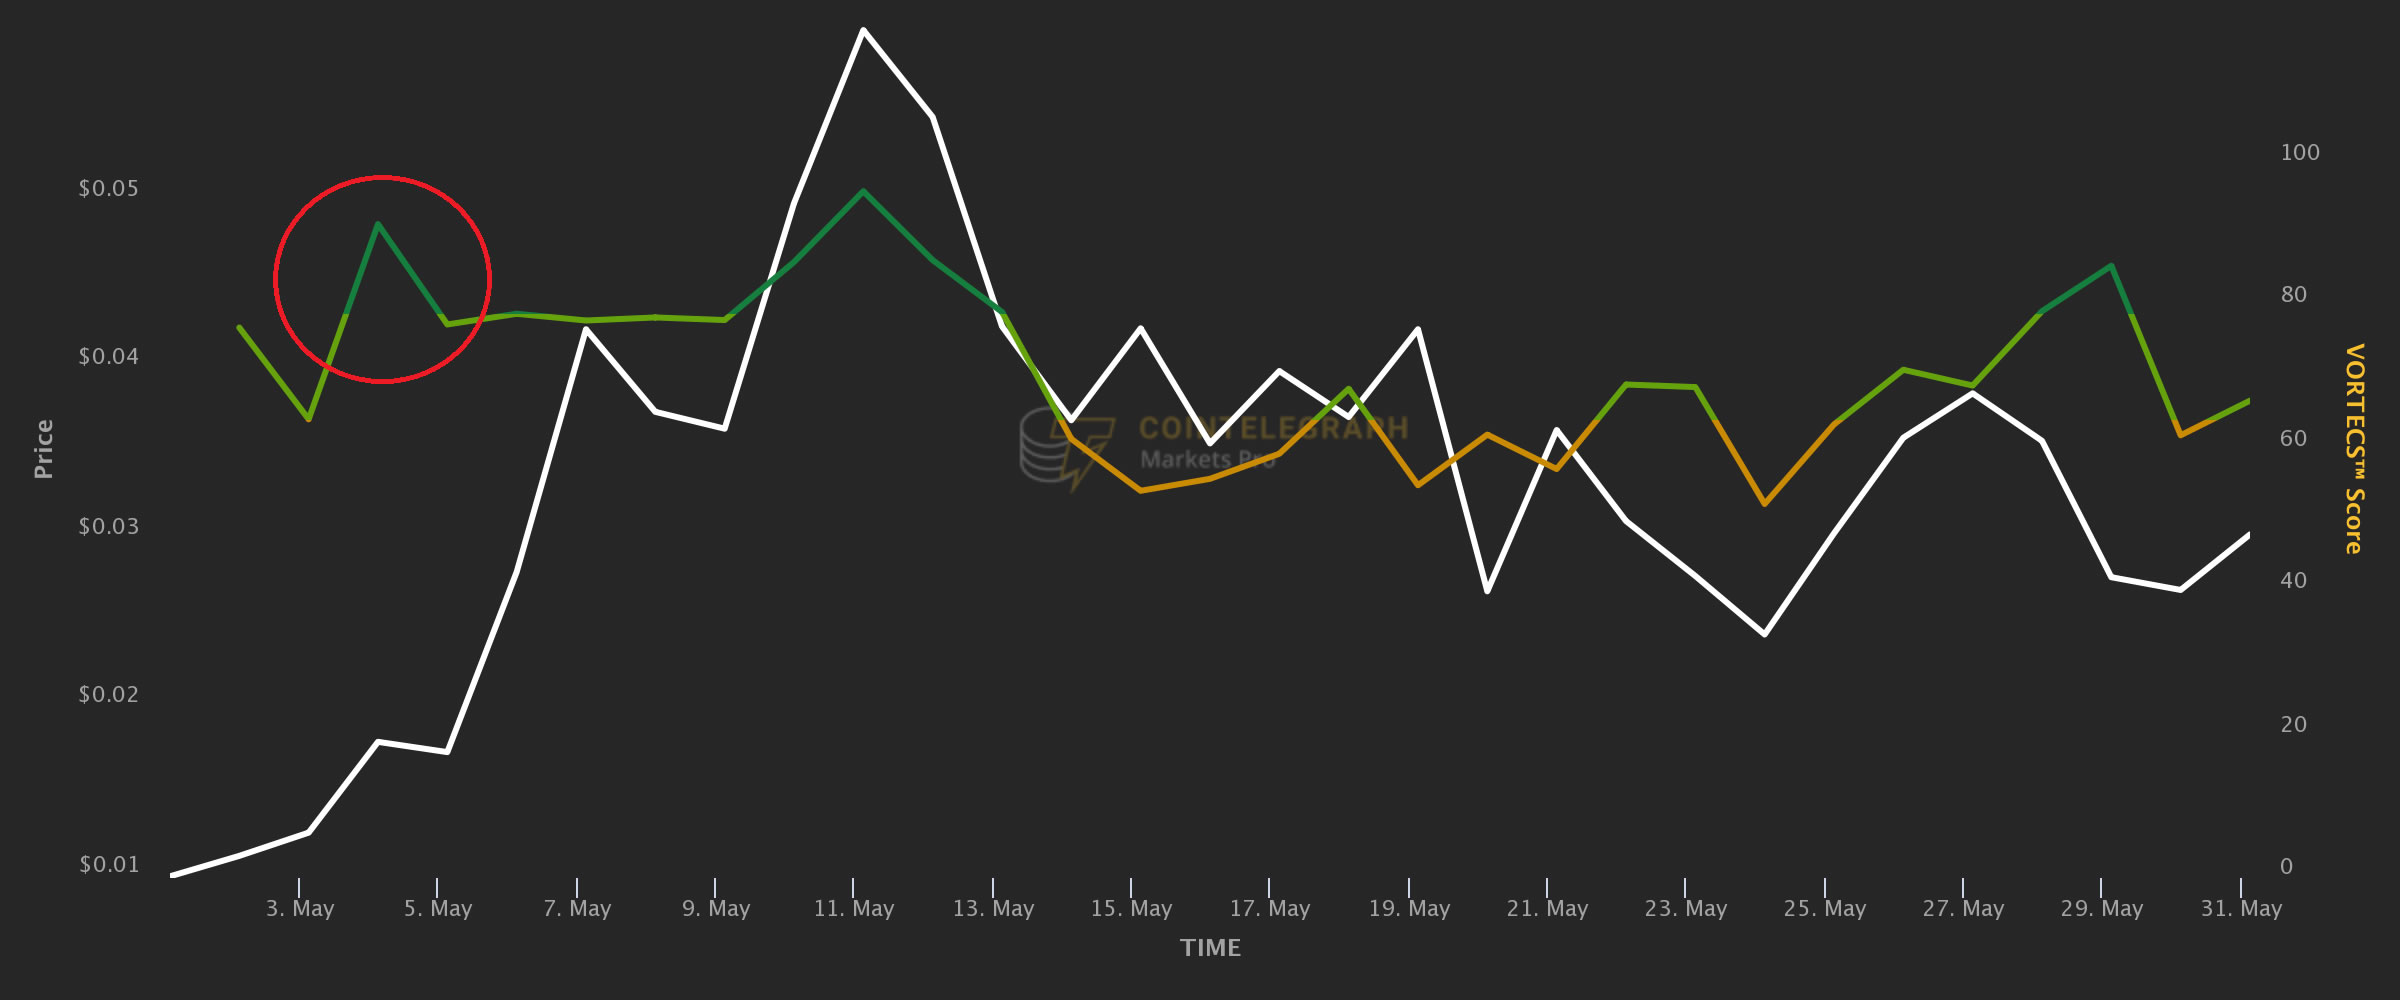
Overall, over the last 30 days, Telcoin delivered 189% vs. the U.S. dollar and 345% vs. Bitcoin (BTC).
Polygon (MATIC): +240% Twitter volume
Twitter activity around MATIC and its price action entered a virtuous circle in May, with each leg of the price rally triggering a surge in chatter that, in turn, preceded a further round of the token’s appreciation.
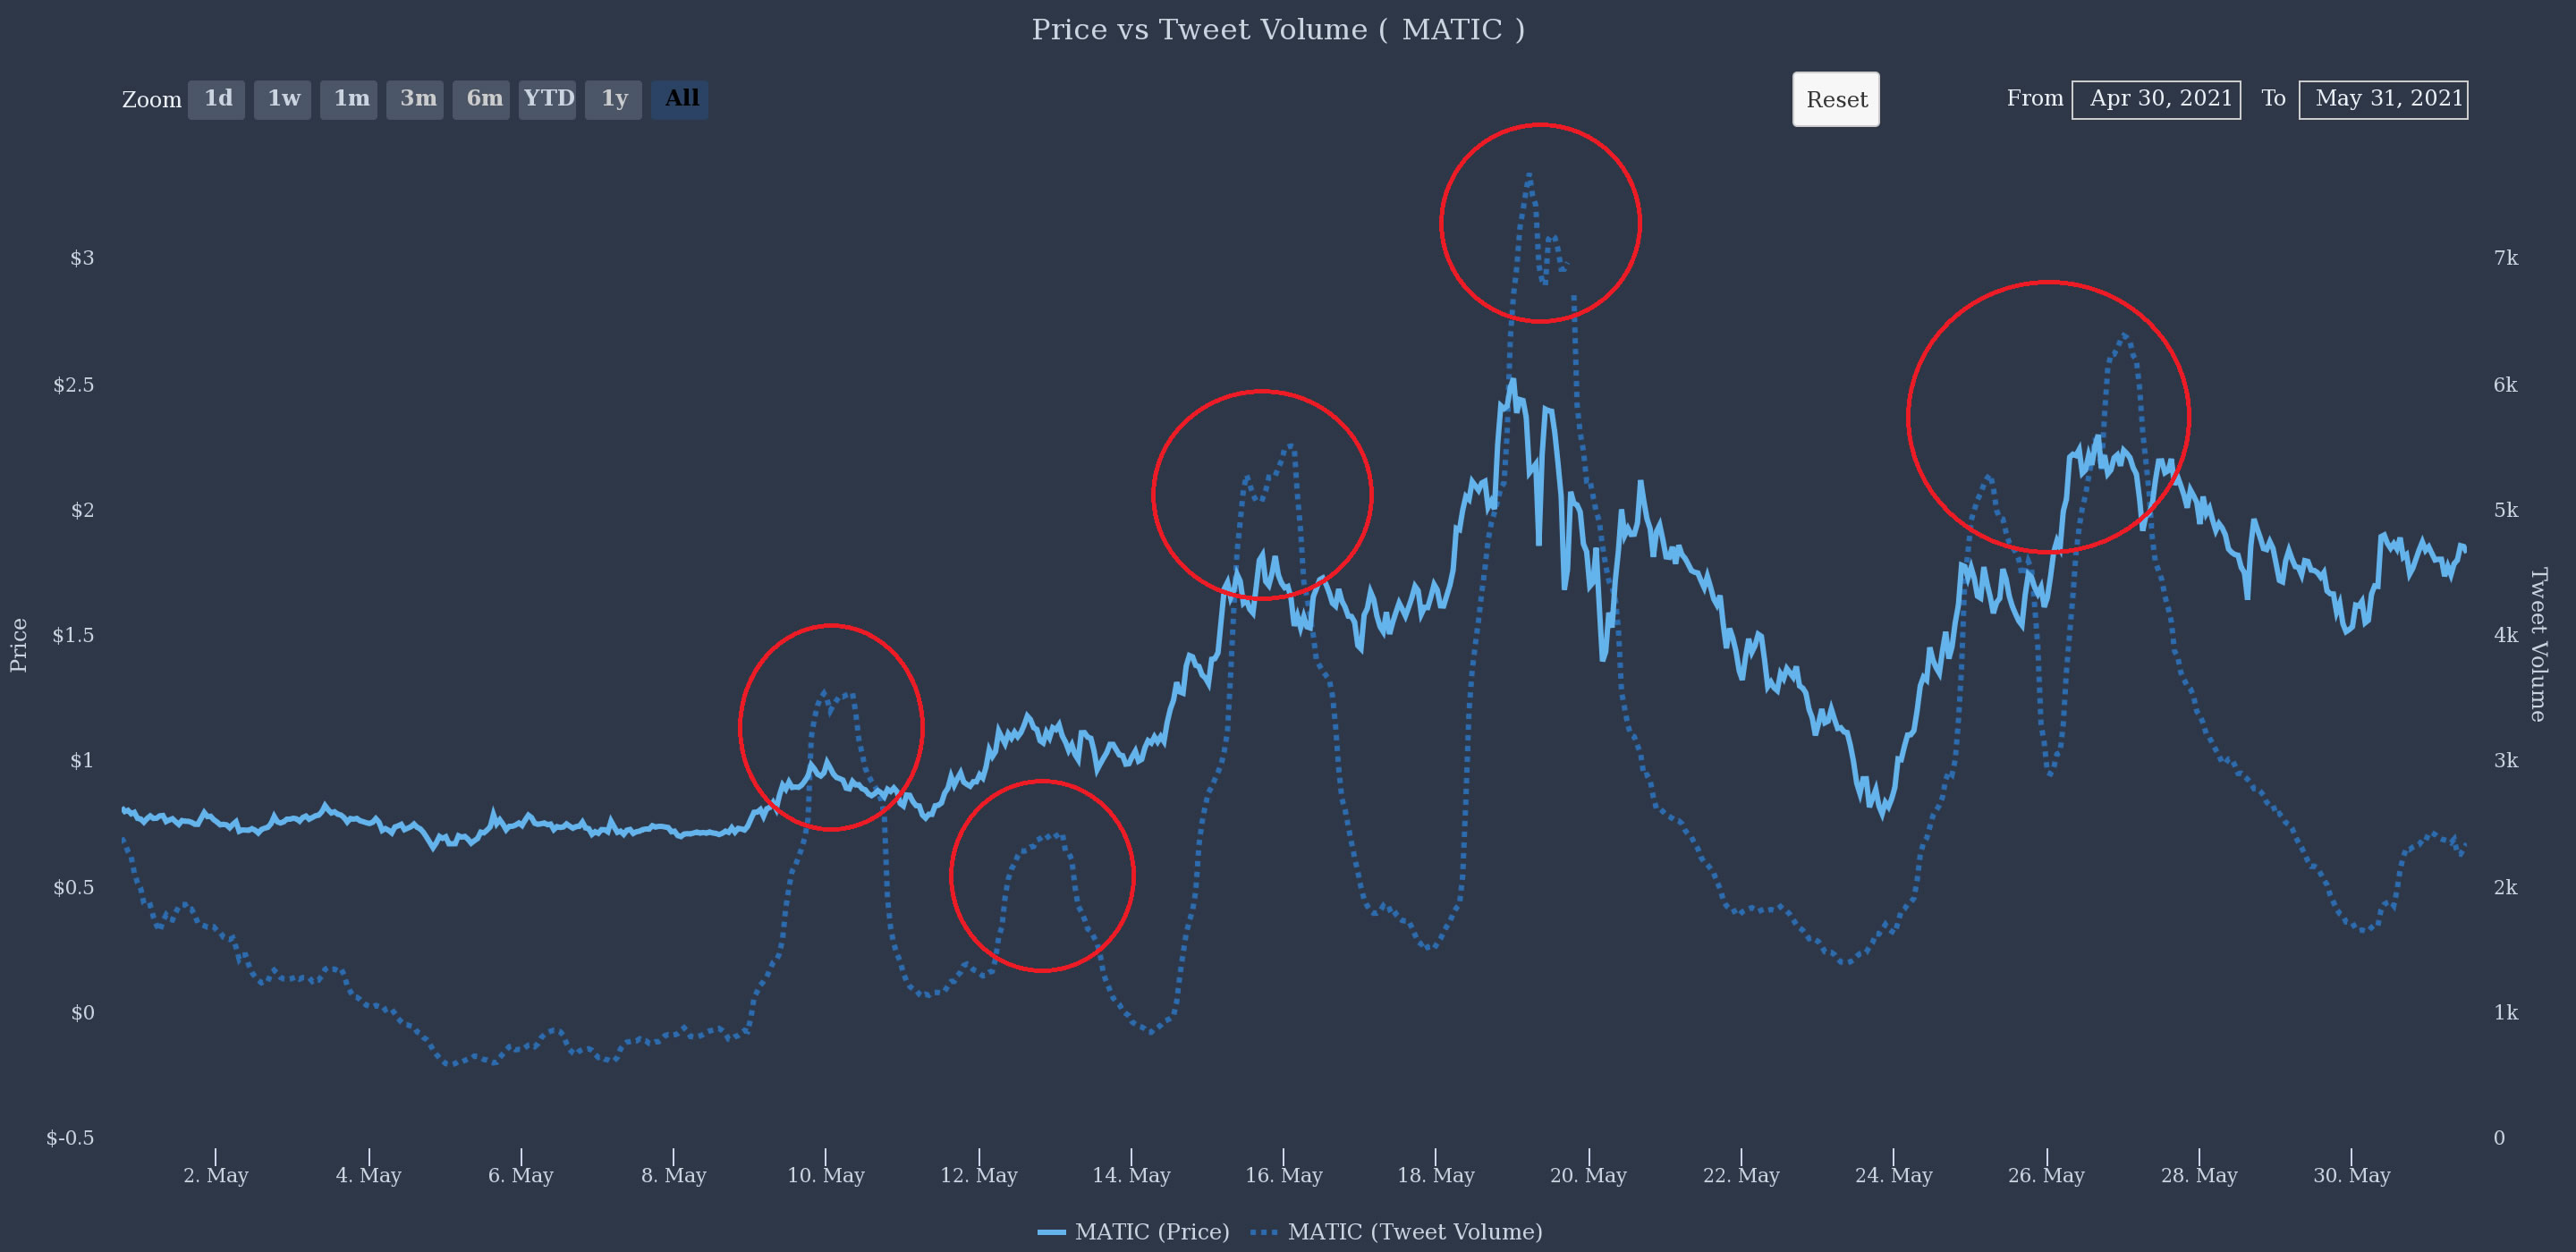
Of course, there was much more to Polygon’s remarkable month, with a slew of positive real-world developments and trading activity spikes, but tweet volume appeared to be an essential feature of each VORTECS™ Score peak (red circles in the chart).
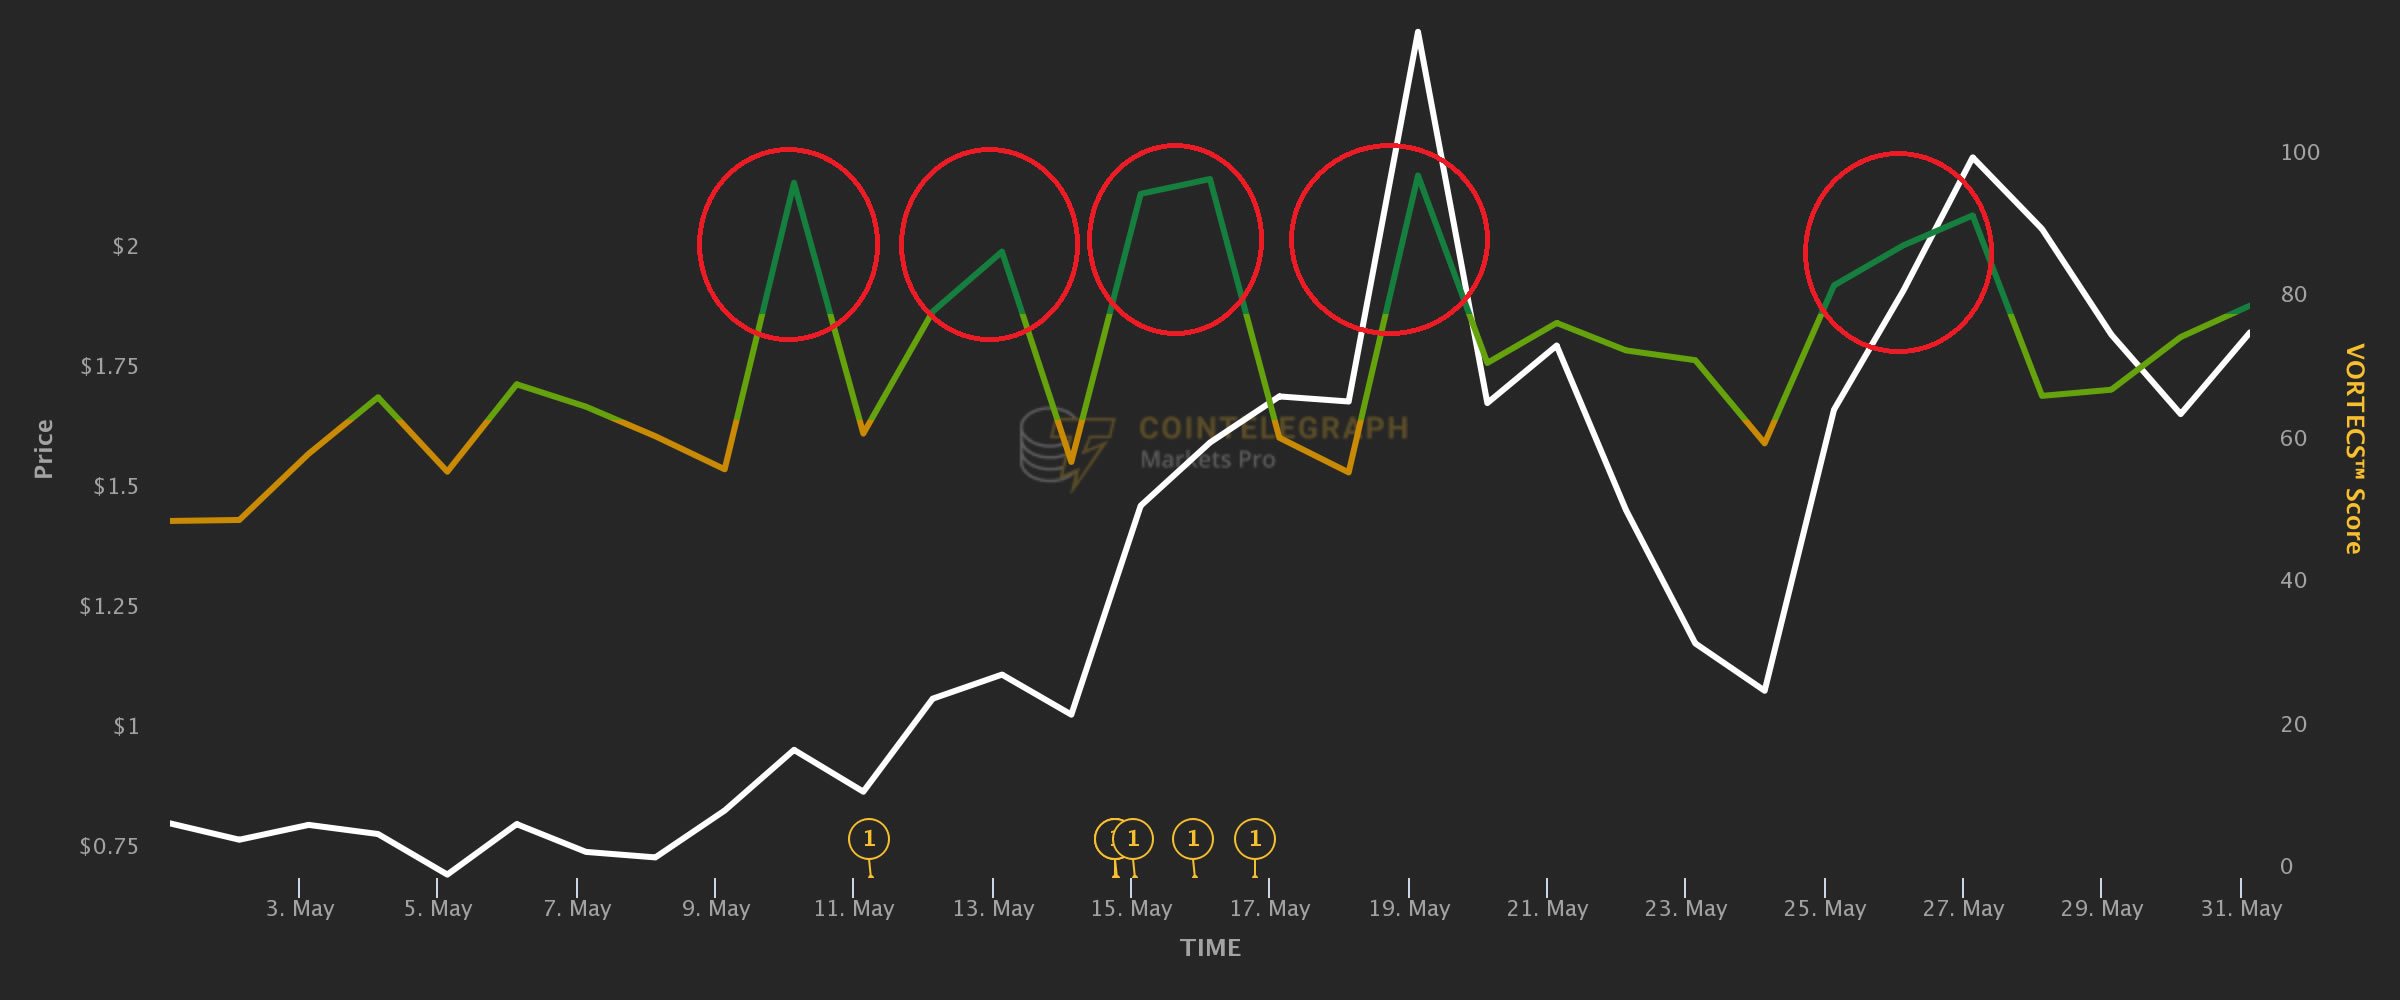
MATIC’s monthly gains: 125% vs. the U.S. dollar and 248% vs. BTC.
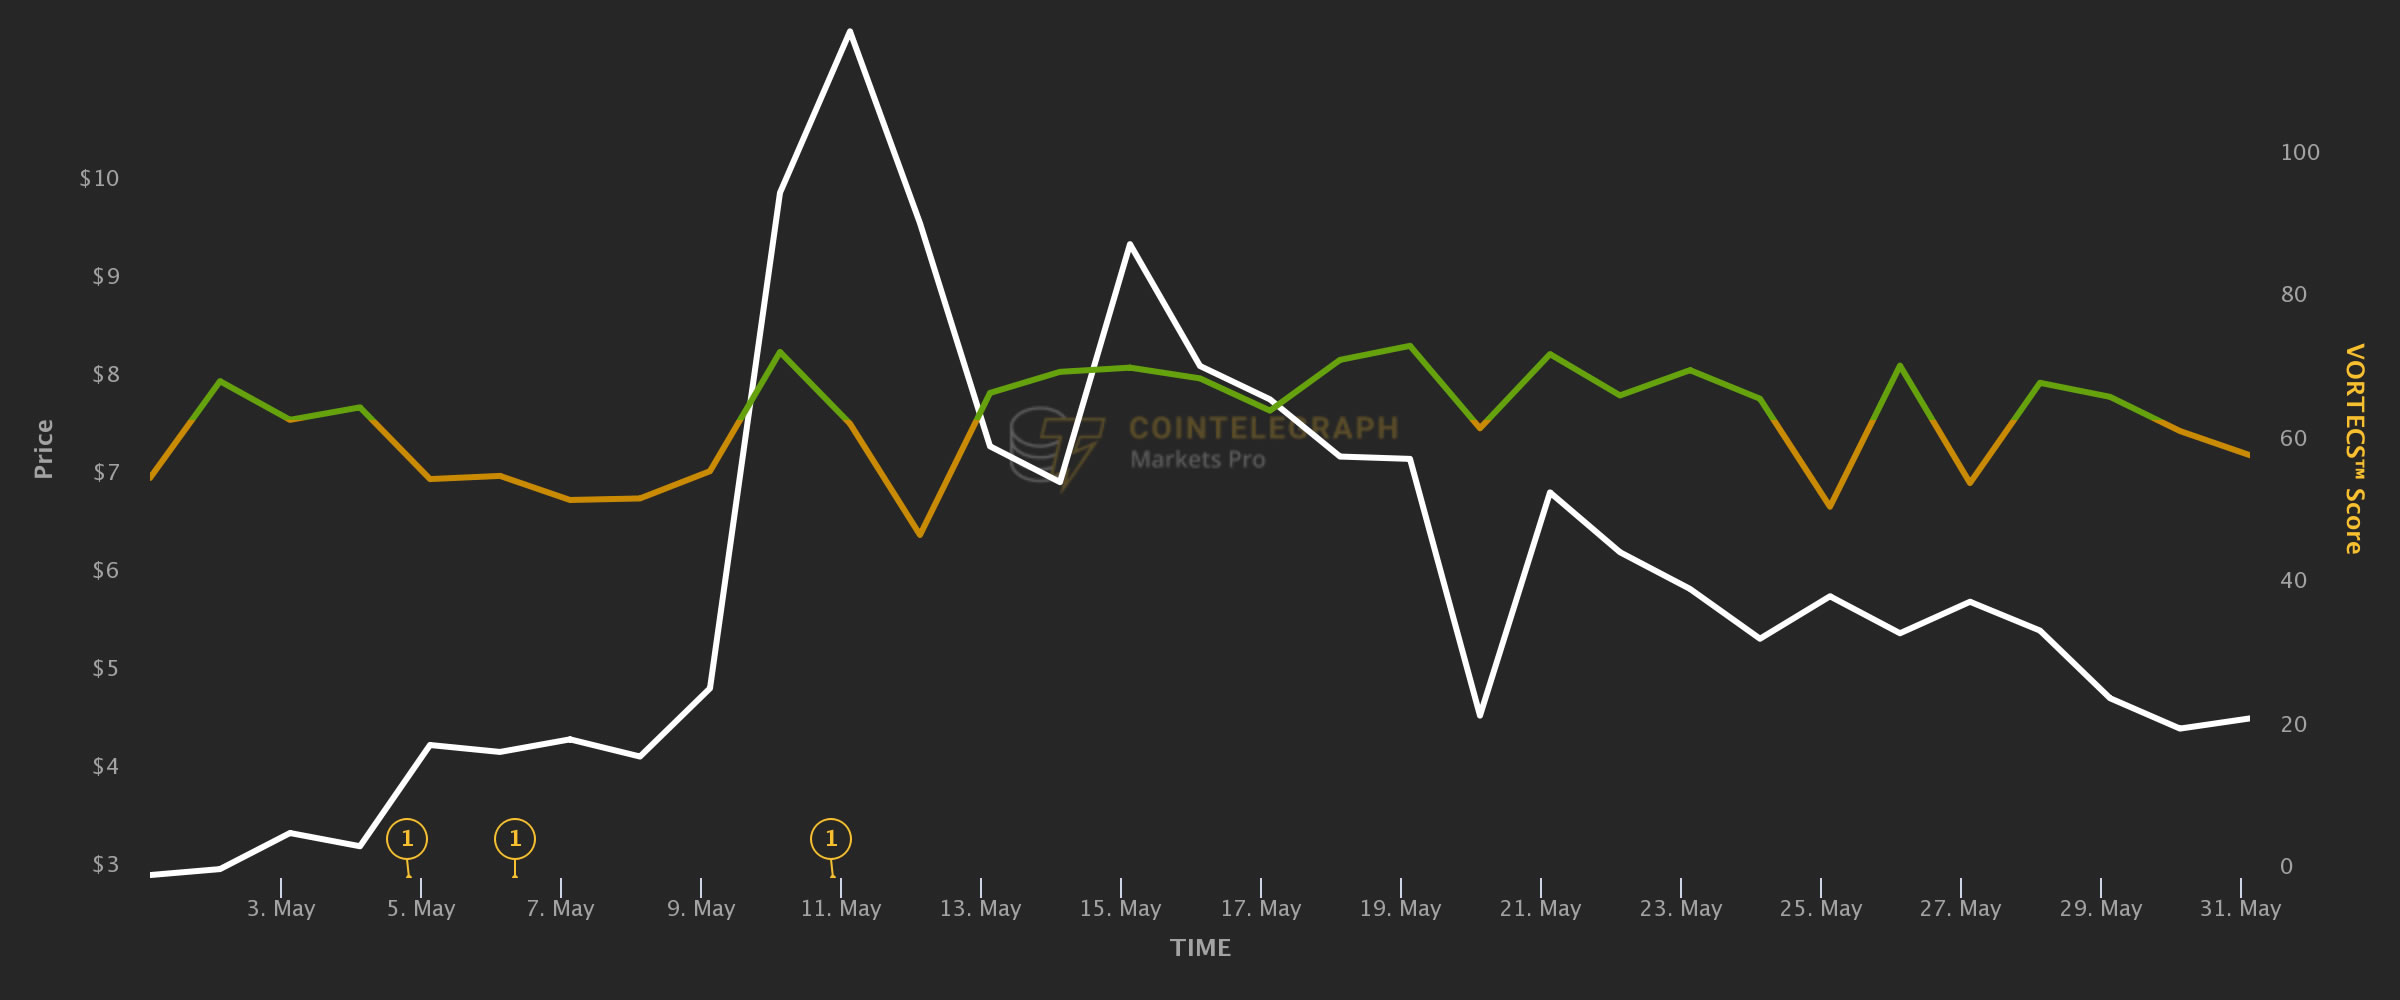
iExec (RLC): +711% Twitter volume
iExec's RLC token emerged as the biggest winner in terms of added tweet volume in May, yet its price increase was more modest: 60% against the U.S. dollar and 148% against Bitcoin.
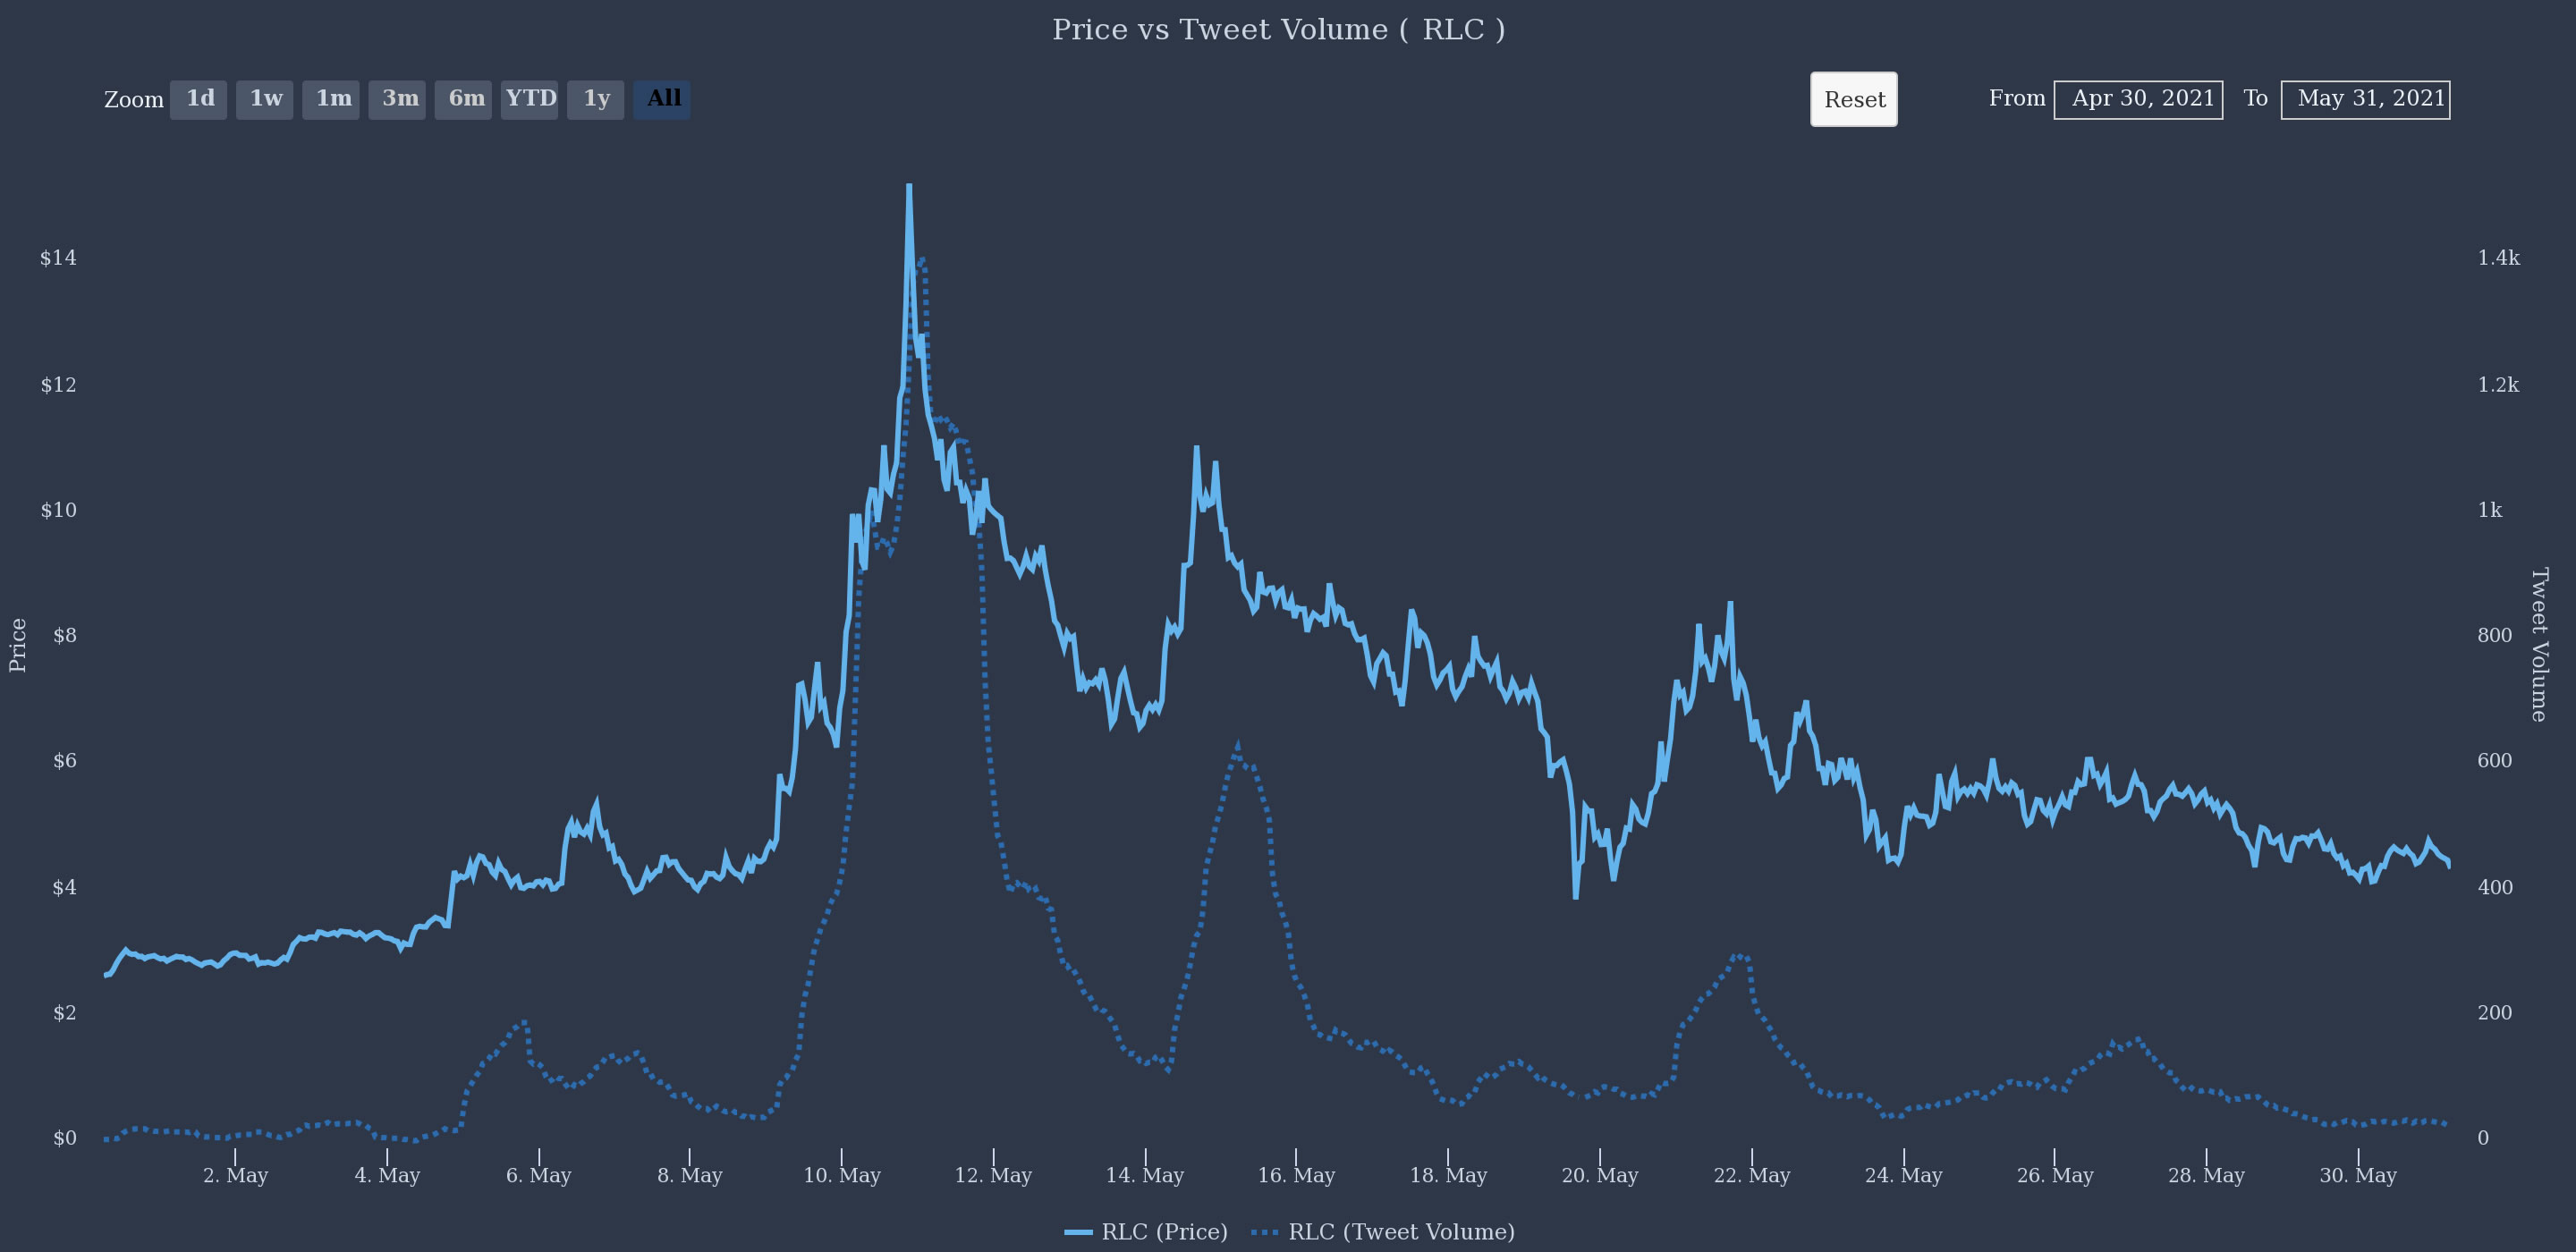
In RLC’s case, as the charts illustrate, spikes in tweet volume were largely reactive and merely followed price action. The coin’s VORTECS™ Score was largely neutral ahead of the rally that started around May 9, suggesting that the combination of market conditions preceding it has not been frequently observed before.
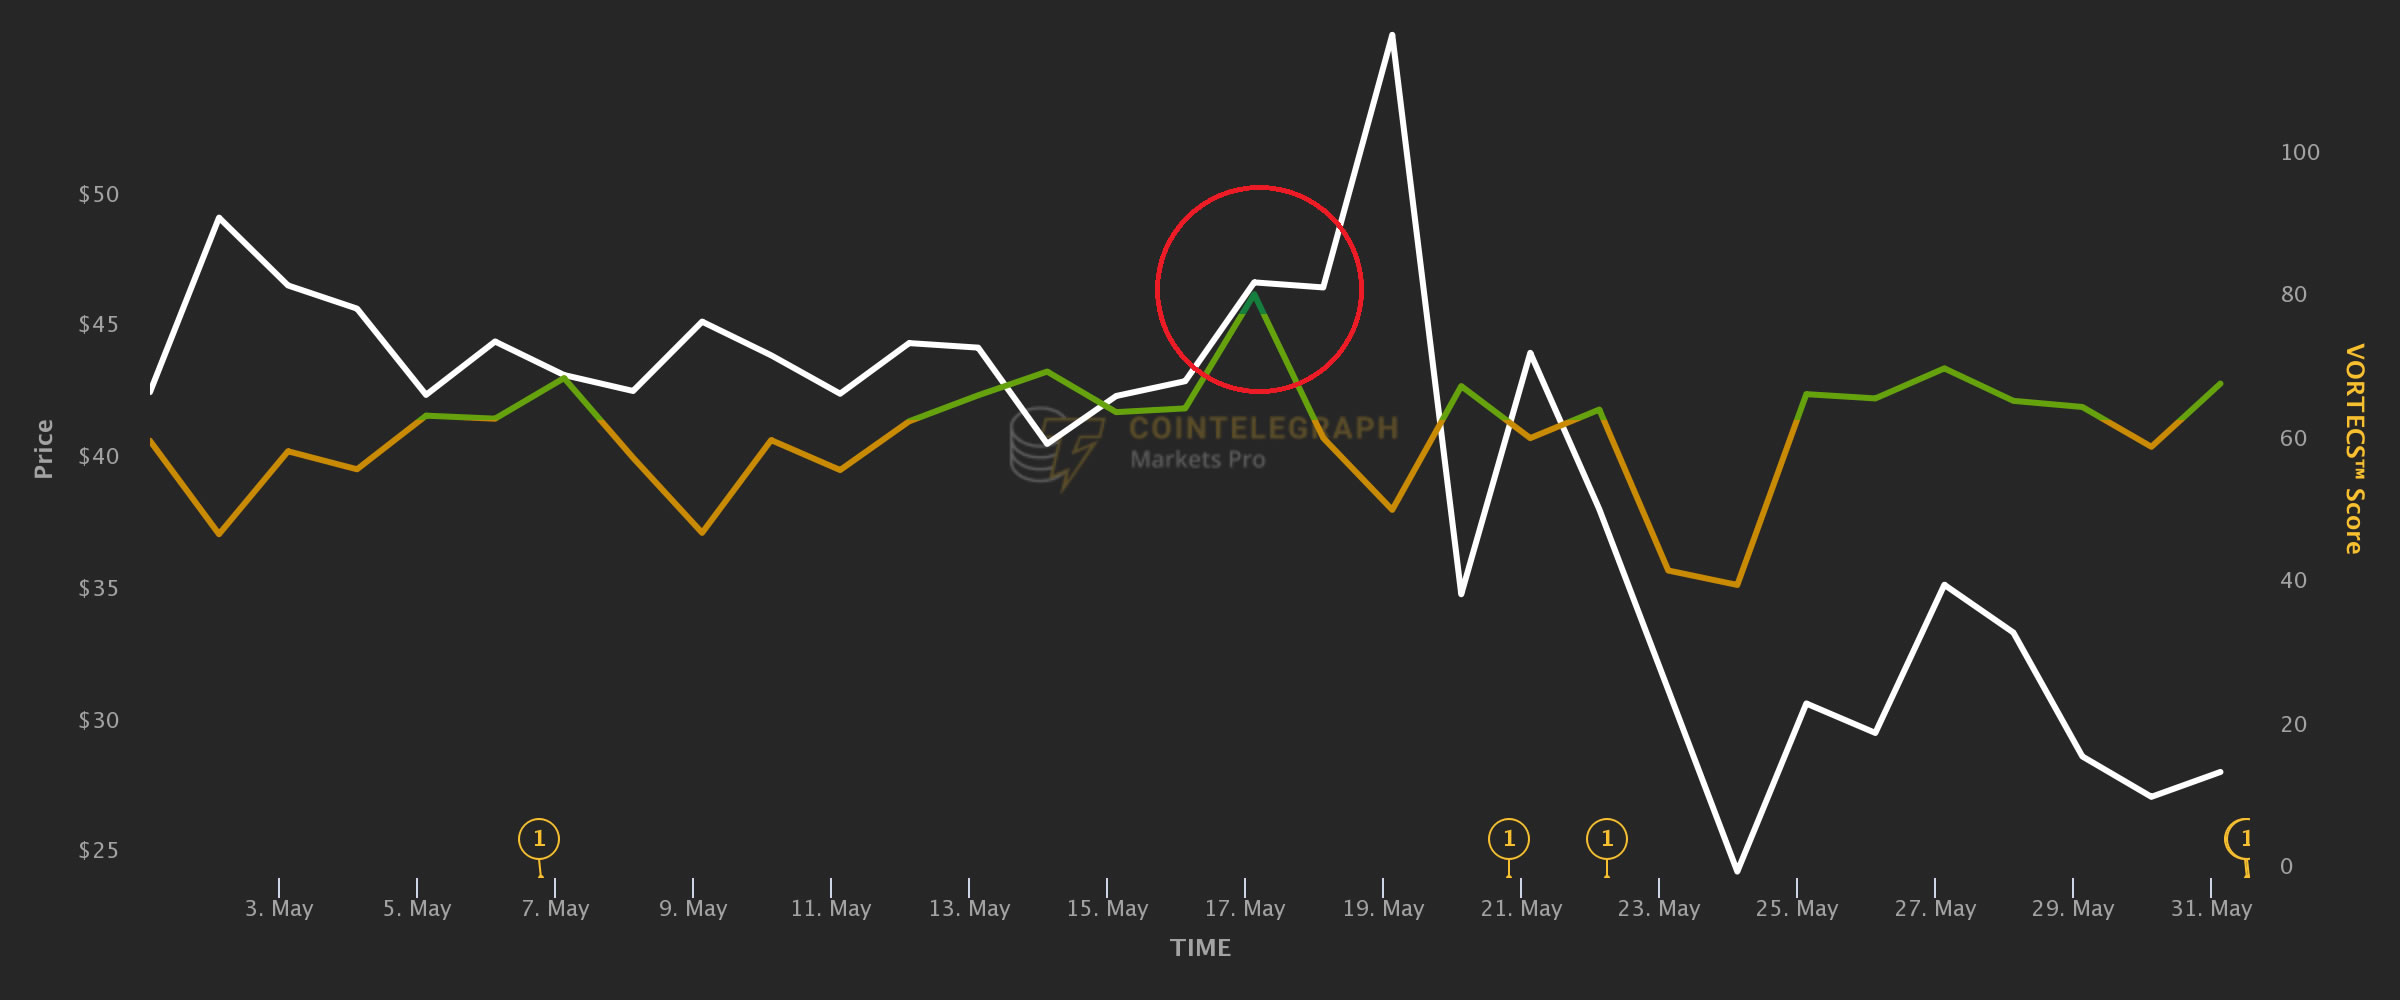
Solana (SOL): +525% Twitter volume
Solana saw its average tweet volume increase more than fourfold compared with the previous month, yet almost all corresponding SOL price gains were wiped out by the end of May: -31.48% against the U.S. dollar and +6.06% against Bitcoin.
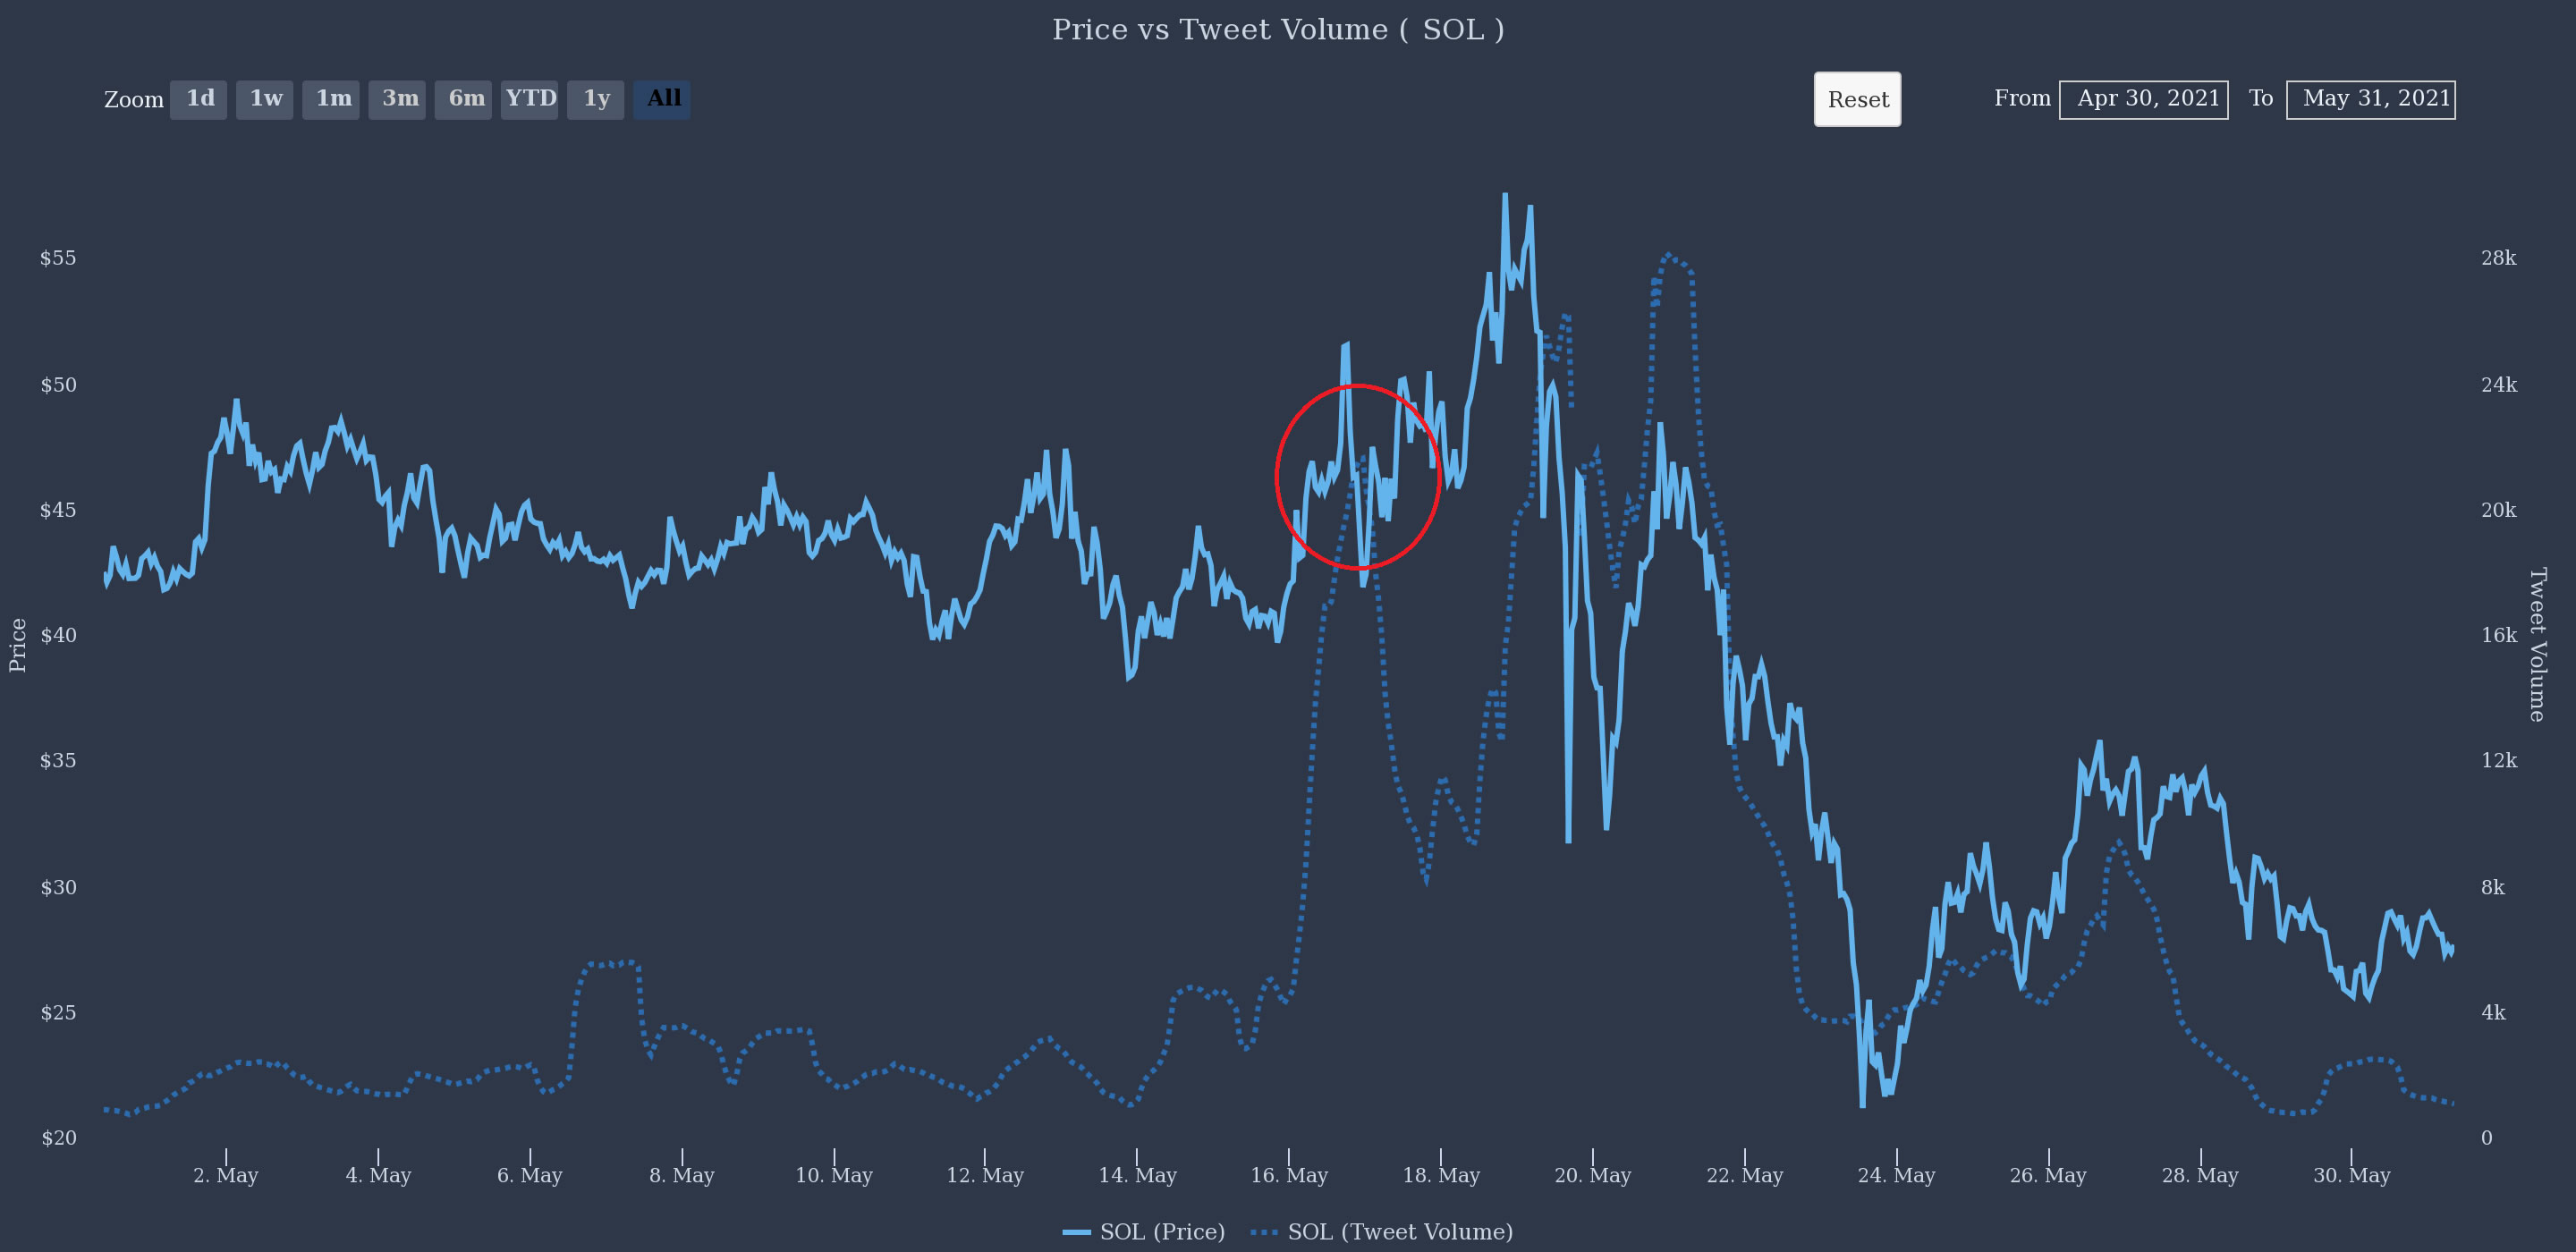
Tweet volume largely lagged behind the price movement, with one notable exception: an outsized jump from 5,000 to 20,000 tweets on May 17 that contributed to an 80+ VORTECS™ Score and came some 36 hours before the coin reached its all-time high near $58 (red circles in both charts).
Ethereum Classic (ETC): +321% Twitter volume
While the reasons behind Ethereum Classic (ETC) suddenly surging from $40 to $160 in the first week of May remain a mystery, we can be fairly certain that an explosion in the volume of Twitter conversation was not one of them: All the added tweets came in response to the price rally.
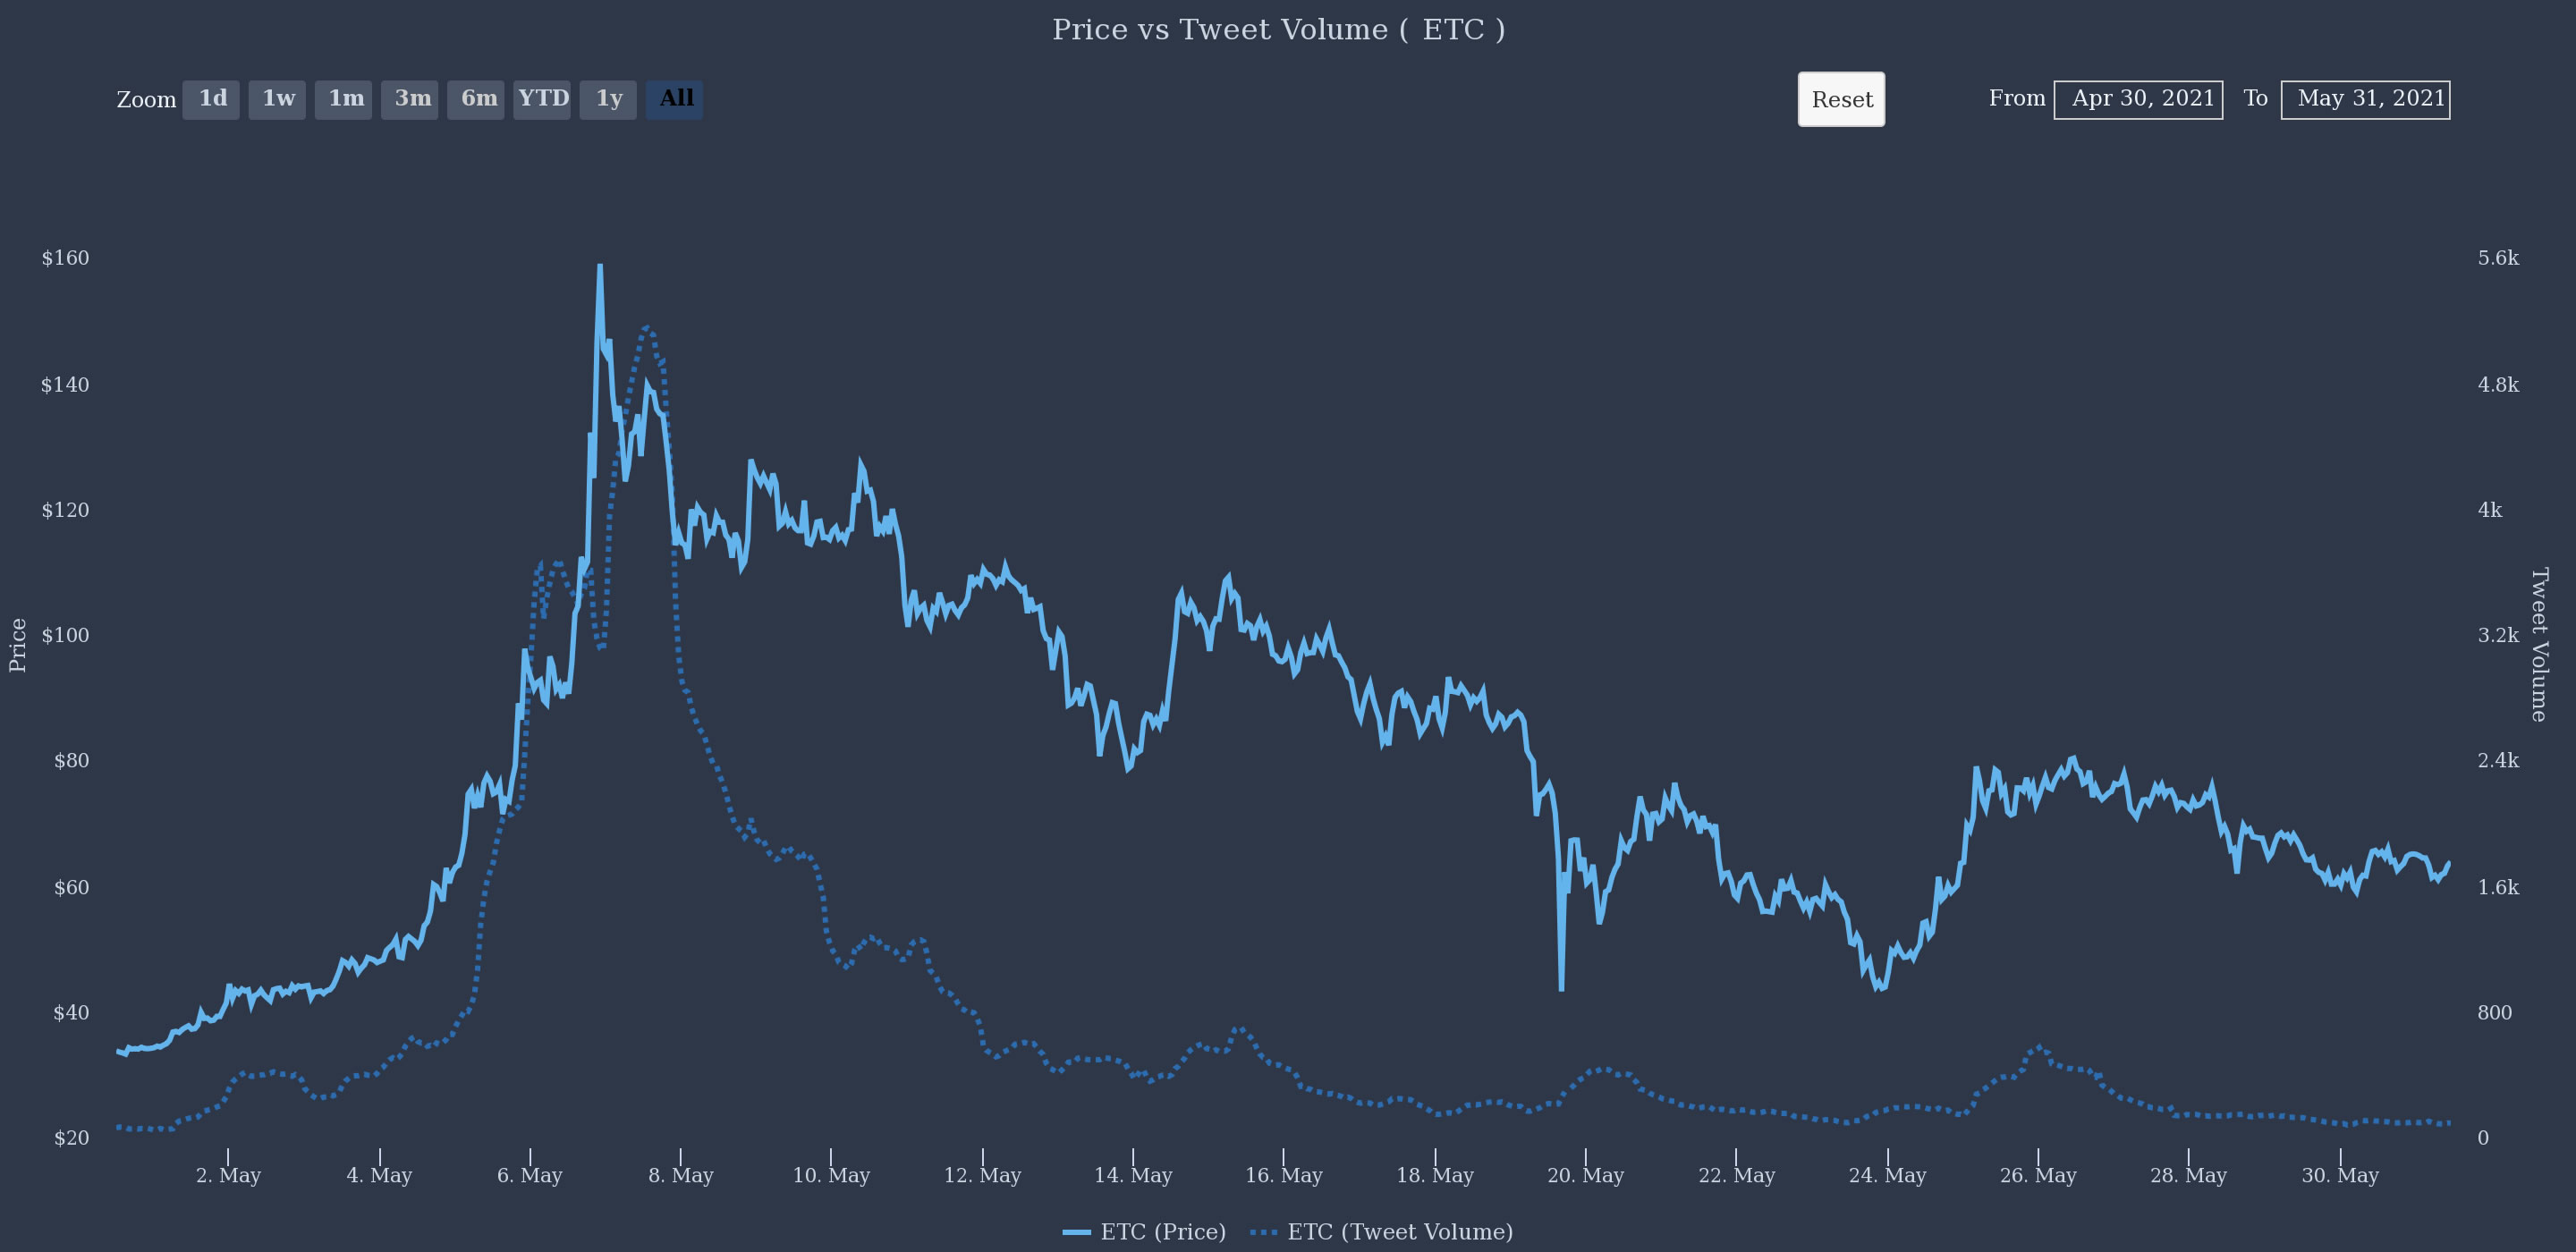
The VORTECS™ algorithm hadn’t sensed a historically favorable outlook, either, as the score mostly remained in the neutral zone.
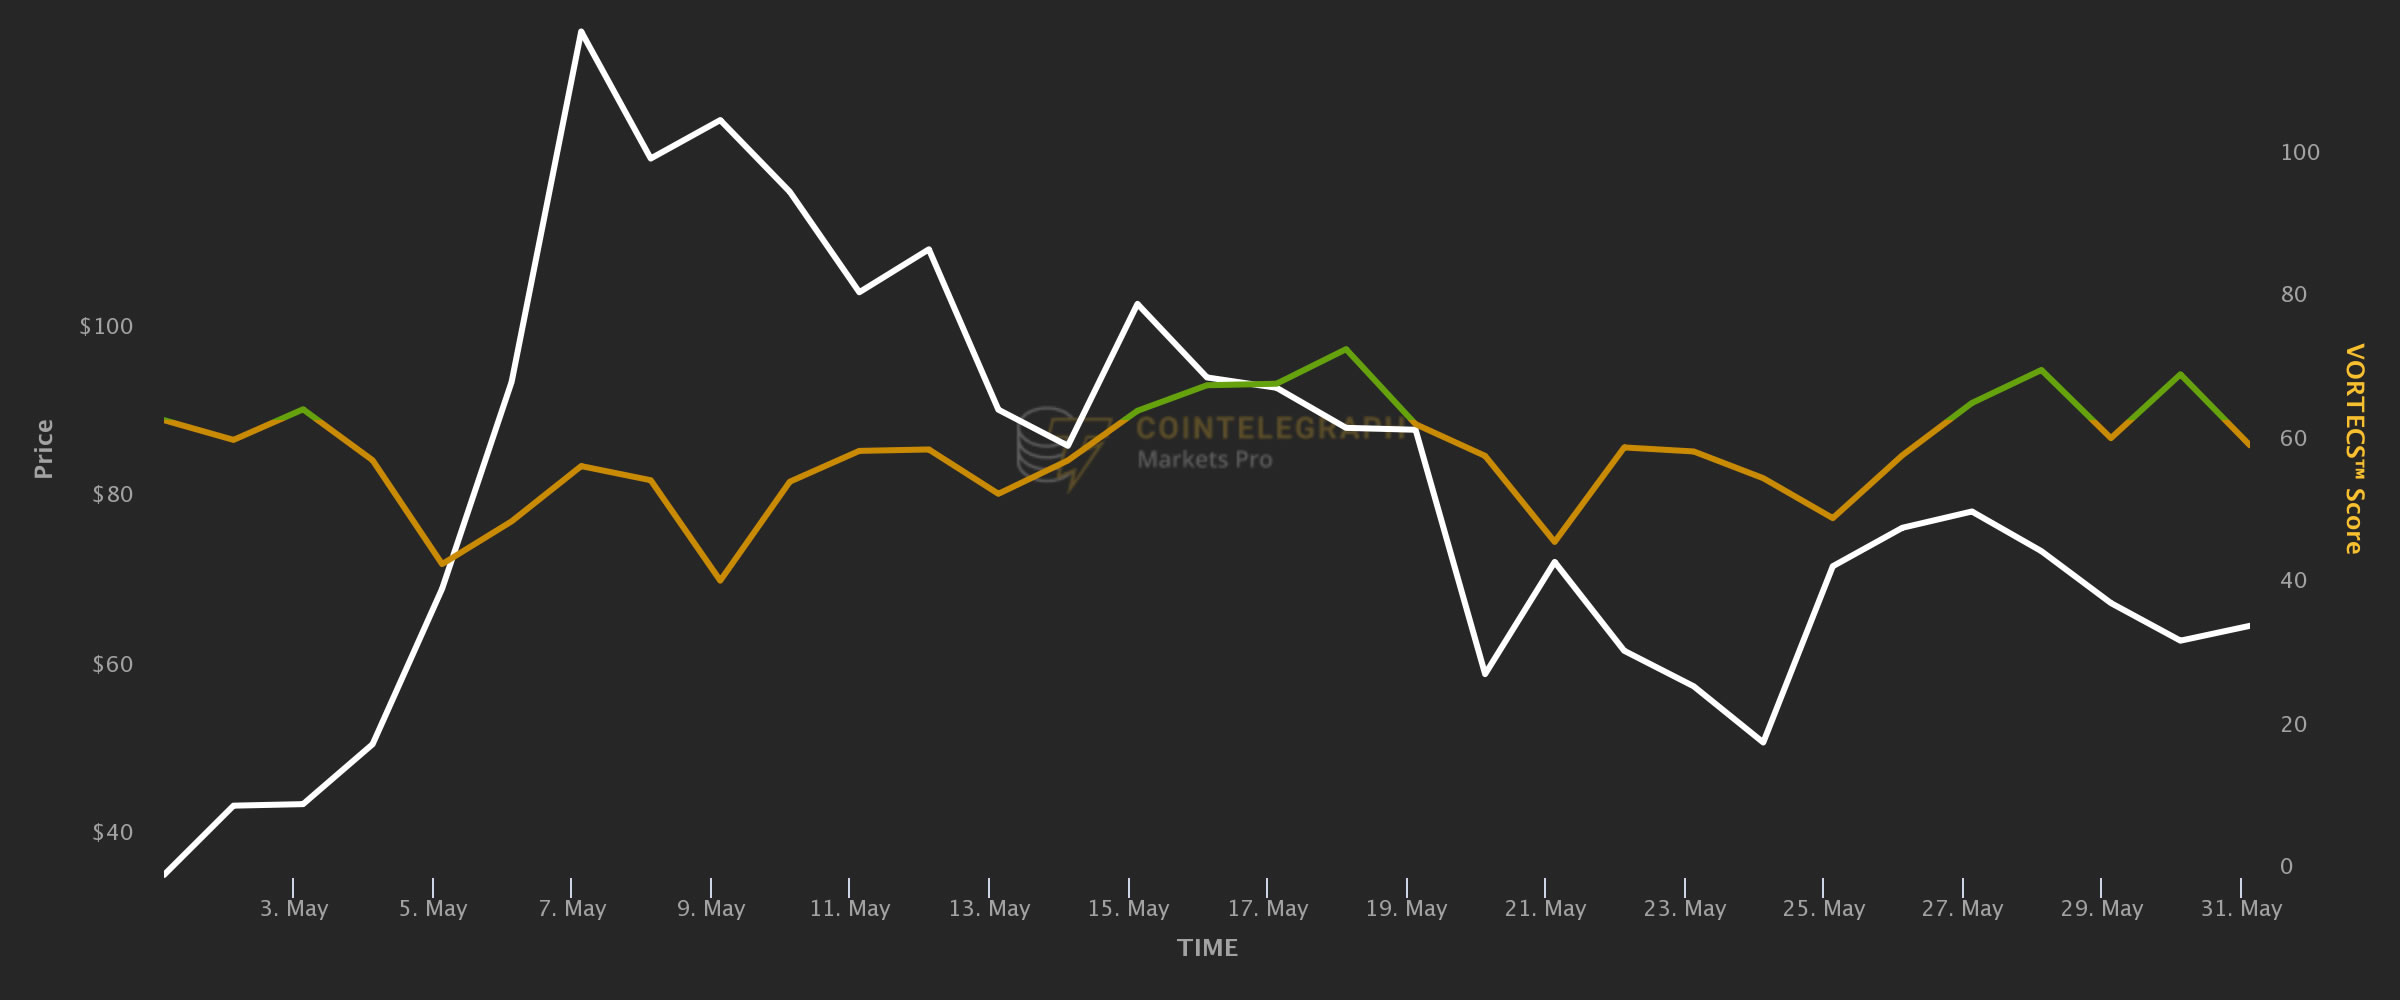
ETC ended the month with +67.36% vs. the U.S. dollar and +158.85% vs. Bitcoin.
An uptick in Twitter activity around a digital asset can mean a variety of things, depending on the configuration of other important market and social indicators. The VORTECS™ Score, exclusively available to Cointelegraph Markets Pro members, can contextualize tweet volume within a constellation of other market-moving metrics.
For those who prefer to leverage raw data, the absolute number of tweets and current vs. average tweet volume are readily available as separate metrics on the market intelligence platform.
Author

Cointelegraph Team
Cointelegraph
We are privileged enough to work with the best and brightest in Bitcoin.


