Bears take over XTZ price after Tezos releases Kathmandu protocol upgrade
- Tezos price uptrend is on hold due to heavy selling pressure at the 200-day SMA and 100-day SMA confluence resistance.
- Tezos Kathmandu protocol upgrade goes live with scaling capabilities.
- XTZ price eyes a daily close above the hurdle at $1.5500 to validate an uptrend to $1.7566.

Tezos price is trading at $1.5267 after defying strong opposing forces witnessed in the cryptocurrency market this week. Investors remain jittery about the worsening economic environment globally, especially with inflation blowing off ceilings in the United States and Europe.
The United Kingdom has hinted at a recession amid a 0.1% decrease in its GDP (Gross Domestic Product), while Germany is at the risk of a -3.5% economic growth in 2023.
Tezos price climbed by almost 4% this week from support at $1.4000. However, profit takers were a stumbling block, forcing XTZ to abandon recovery on tagging $1.550. Support at $1.5170 must hold to prevent losses from erasing the token’s weekly progress.
Tezos Kathmandu upgrade opens up the protocol to scaling capabilities
Tezos announced its 11th protocol upgrade dubbed Kathmandu on September 23. The team said that the software upgrade is equipped to support off-chain computation using Layer 2 solutions such as optimistic roll-ups. Users can generally look forward to a better experience due to the streamlined blockchain process to achieve a higher transaction throughput.
Welcome to #Kathmandu - @Tezos' 11th protocol upgrade.
— Tezos (@tezos) September 23, 2022
The #blockchain built to last.#Tezos #BlockchainEvolved pic.twitter.com/doFOKxJaY4
The team added in the upgrade’s formal proposal that Tezos now has a dedicated testnet protocol to be utilized when experimenting with new features – improving the random nature of the mainnet delegate selection, a move designed to enhance network security.
Investors positively reacted to the Kathmandu protocol upgrade by grabbing new positions. However, the bear market has taught traders to book early profits, thus initiating an ongoing pullback from a solid confluence resistance formed by the 100-day (blue) Simple Moving Average (SMA) and the 200-day SMA.
Now, all eyes are focused on the 38.2% Fibonacci retracement level’s ability to absorb the rising selling pressure at $1.5192. Buyers may take back control if the Moving Average Convergence Divergence (MACD) firmly holds its positive outlook. Odds will favor a move up the ladder as long as the MACD settles above the mean line.
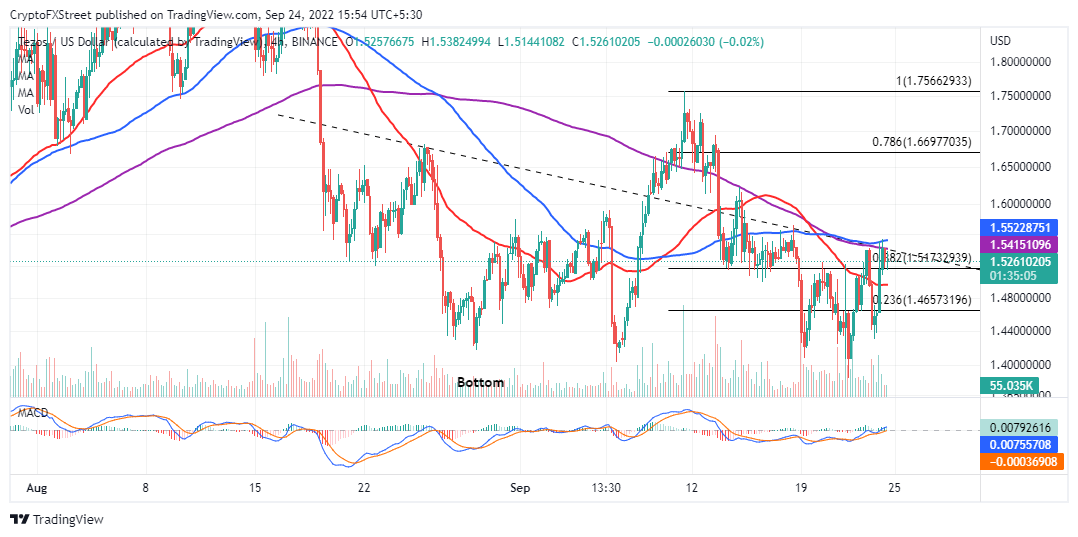
XTZ/USD four-hour chart
Investors will be looking for new entry positions at the 50-day SMA (red) if support at $1.5192 disintegrates. They may need to look for entries further down at $1.440 and $1.4000 if a selloff flares up.
Author

John Isige
FXStreet
John Isige is a seasoned cryptocurrency journalist and markets analyst committed to delivering high-quality, actionable insights tailored to traders, investors, and crypto enthusiasts. He enjoys deep dives into emerging Web3 tren