Summary
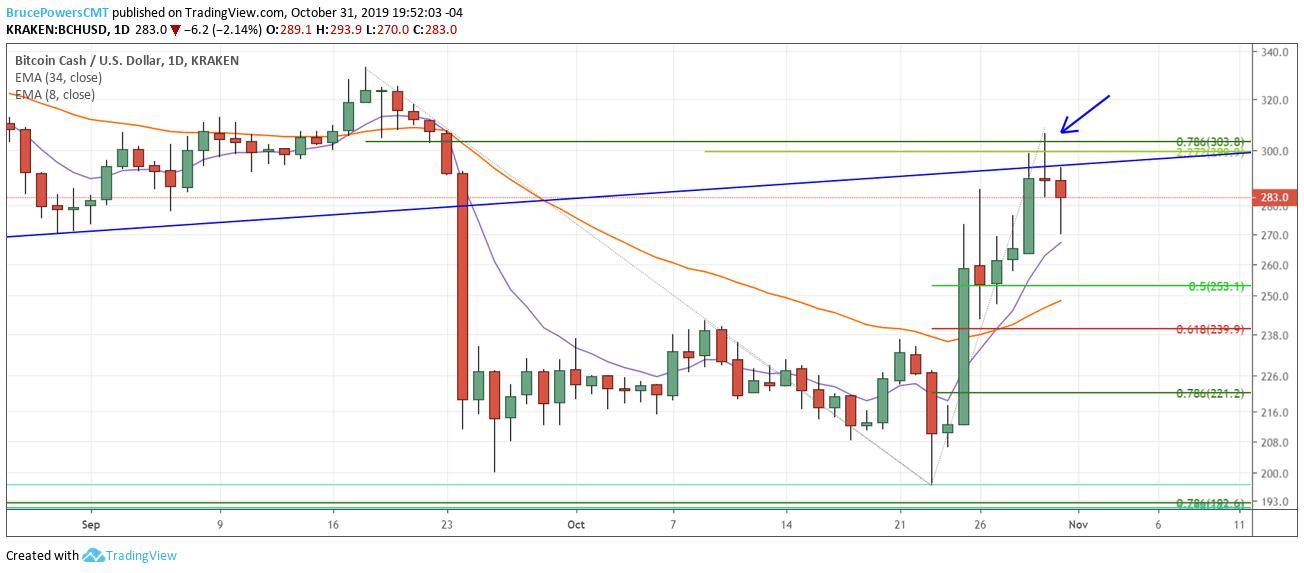
- Bearish doji candlestick pattern occurs after seven days up.
- Occurs on test of neckline of large bearish head & shoulders topping pattern.
- Potentially significant drop possible to below most recent swing low.
Near-term bearish signs for Bitcoin Cash
A bearish daily Doji candlestick pattern occurs in Bitcoin Cash (BCH/USD) following seven days up, while a potential 1-day reversal triggered with a break below the candle’s low. This is the first time in eight days that price has dropped below the prior day’s low and is a clear change in the pattern of higher daily lows and higher daily highs.
The potential topping pattern occurs in an area of potential resistance identified by:
- Neckline resistance of large bearish head and shoulder top pattern (HS).
- Area of 78.6% Fibonacci retracement of most recent swing high to low decline.
- Bearish 14-period divergence occurs on 4-hour chart.
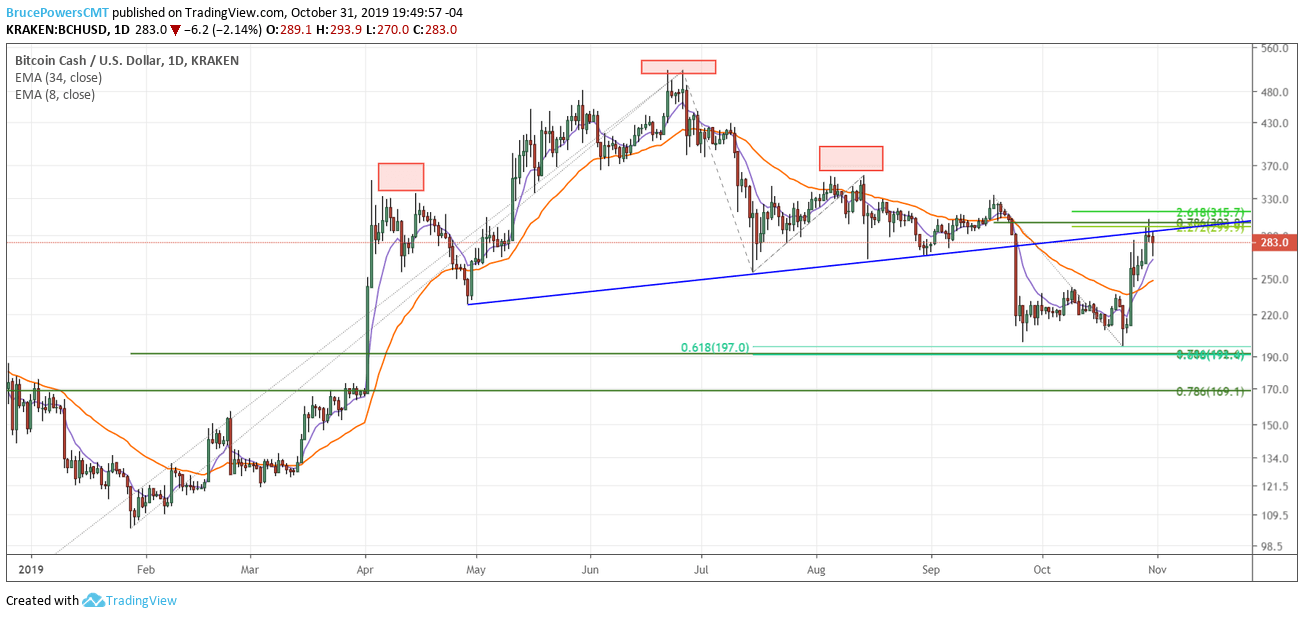
Most recent low to $196.80 was not close to reaching the measuring objective based on a percentage measurement, of approximately $144.54. Therefore, this pair has the potential to fall well below the most recent swing low. This doesn’t mean that it will, just that it could.
A move above the most recent trend high at $306.70 will negate the above potentially bearish analysis.
The views and opinions expressed here are solely those of the authors / contributors and do not necessarily reflect the views of Marketstoday.net. Neither Marketstoday.net nor any person acting on its behalf may be responsible for information contained herein. The content posted here may have been edited to conform to Marketstoday.net policies, terms and conditions. Any investment / trading related article, analysis or commentary are by no means a guarantee of present or future performance and should not be relied upon solely when buying or selling a financial instrument. Every investment no matter how appealing, involves risk and the investor should conduct their own research, consider personal risk tolerance, preference and needs when making an investment or trading decision.
Recommended Content
Editors’ Picks

Cardano stabilizes near $0.62 after Trump’s 90-day tariff pause-led surge
Cardano stabilizes around $0.62 on Thursday after a sharp recovery the previous day, triggered by US Donald Trump’s decision to pause tariffs for 90 days except for China and other countries that had retaliated against the reciprocal tariffs announced on April 2.

Solana signals bullish breakout as Huma Finance 2.0 launches on the network
Solana retests falling wedge pattern resistance as a 30% breakout looms. Huma Finance 2.0 joins the Solana DeFi ecosystem, allowing access to stable, real yield. A neutral RSI and macroeconomic uncertainty due to US President Donald Trump’s tariff policy could limit SOL’s rebound.

Bitcoin stabilizes around $82,000, Dead-Cat bounce or trendline breakout
Bitcoin (BTC) price stabilizes at around $82,000 on Thursday after recovering 8.25% the previous day. US President Donald Trump's announcement of a 90-day tariff pause on Wednesday triggered a sharp recovery in the crypto market.

Top 3 gainers Flare, Ondo and Bittensor: Will altcoins outperform Bitcoin after Trump's tariff pause?
Altcoins led by Flare, Ondo and Bittensor surge on Thursday as markets welcome President Trump's tariff pause. Bitcoin rally falters as traders quickly book profits amid Trump's constantly changing tariff policy.

Bitcoin Weekly Forecast: Tariff ‘Liberation Day’ sparks liquidation in crypto market
Bitcoin (BTC) price remains under selling pressure and trades near $84,000 when writing on Friday after a rejection from a key resistance level earlier this week.

The Best brokers to trade EUR/USD
SPONSORED Discover the top brokers for trading EUR/USD in 2025. Our list features brokers with competitive spreads, fast execution, and powerful platforms. Whether you're a beginner or an expert, find the right partner to navigate the dynamic Forex market.