![]() Lorenzo Stroe
Lorenzo Stroe
Independent Analyst
- Band Protocol price has broken out of a 12-hour inverse head and shoulders pattern.
- The digital asset has re-tested the previous resistance trendline and it’s ready for a massive rebound.
Band Protocol was forming an inverse head and shoulders pattern on the 12-hour chart since October 2020 and saw a breakout on January 2021. The digital asset managed to climb above $11 from the neckline resistance at $7.4 but has recently dropped to re-test this level again.
Band Protocol price could explode to $14.5 if support holds
The previous neckline resistance level at $7.4 from the inverse head and shoulders pattern is now a robust support level. After the breakout towards $11, the digital asset has plummeted to the neckline and has been able to hold it so far.
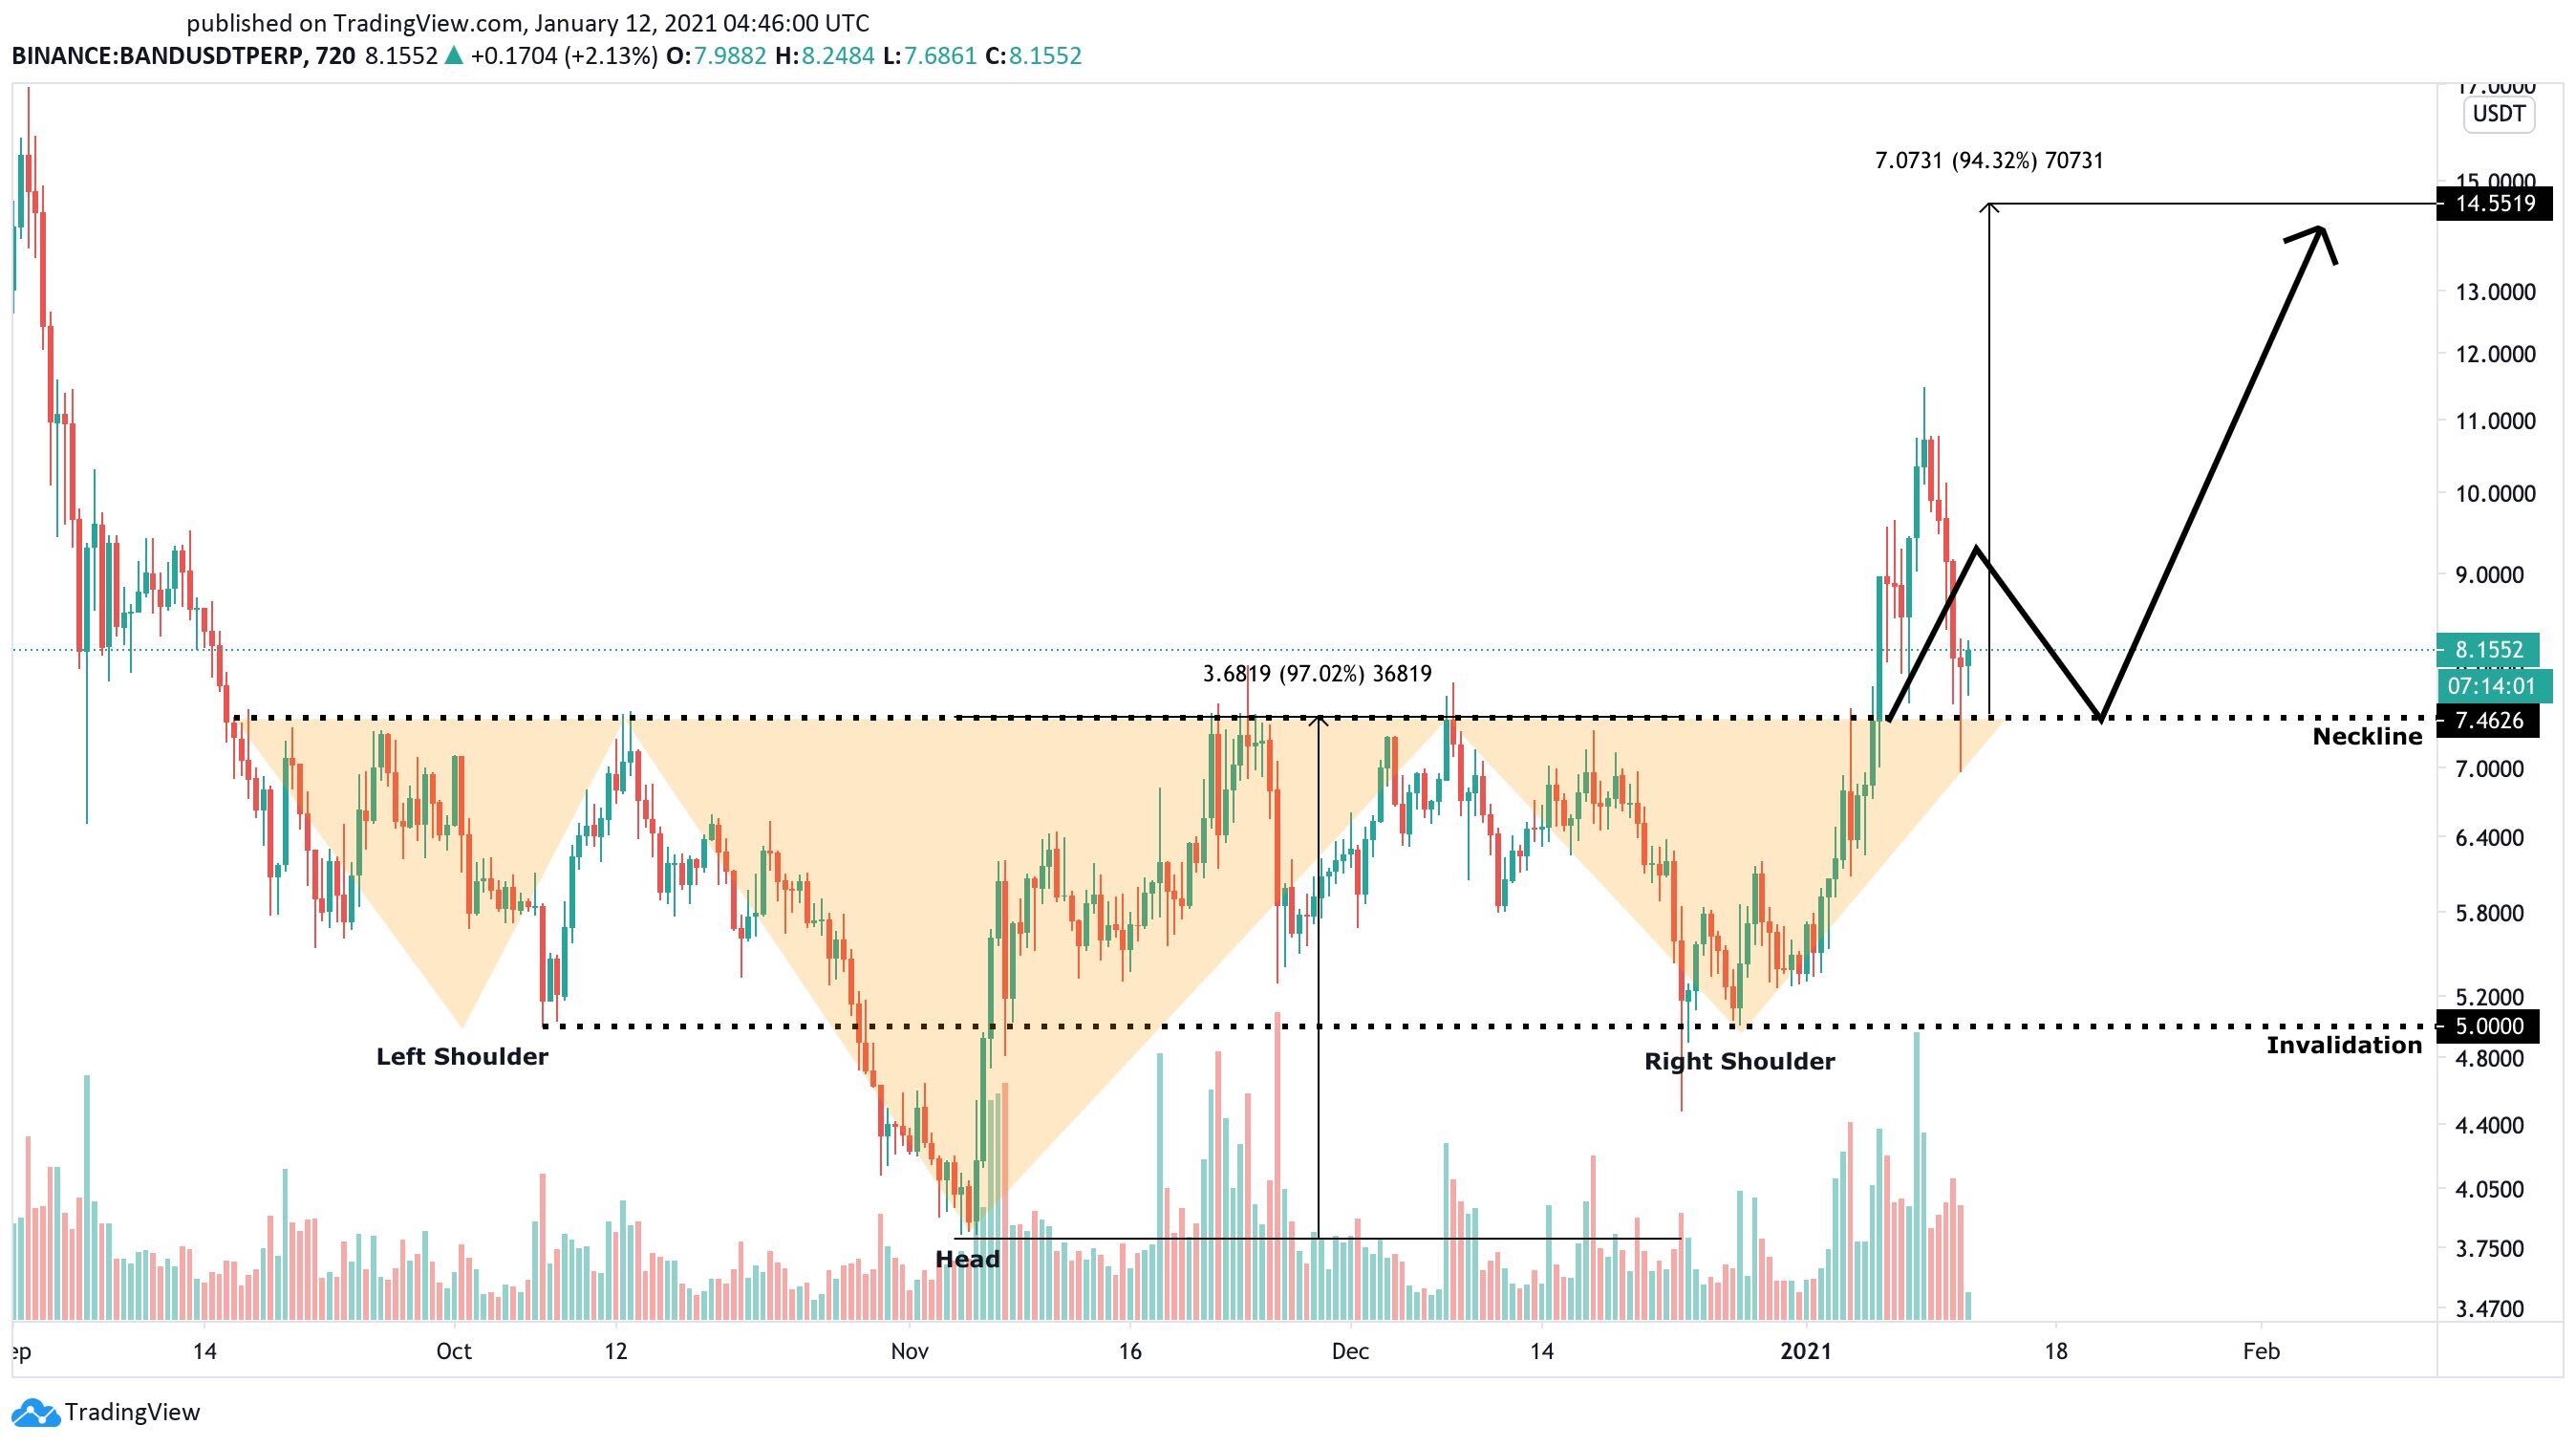
BAND/USD 12-hour chart
A successful defense of this critical support level could quickly drive Band Protocol price towards the last price target of $14.55, which is determined by using the height of the pattern from the neckline to the low end of the head.
-637460584382681438.jpg)
BAND IOMAP chart
According to the In/Out of the Money Around Price (IOMAP) chart, there is a strong support area between $7.83 and $8.06 as well as $6.85 and $7.10, giving a lot of credence to the bullish outlook and the $7.4 support level.
-637460584412213945.jpg)
BAND Age Consumed
After the significant dip from its high point of $11.45 reached on January 9 to the low of $6.98 seen on January 11, the Age Consumed metric shows a massive spike which indicates there is a good chance the digital asset will experience high volatility in the near future.
-637460584445185179.jpg)
BAND Holders Distribution chart
Additionally, it seems that BAND whales have continued to accumulate the cryptocurrency despite the price plummeting. In the past three days, the number of whales holding between 10,000 and 100,000 coins has increased by five. Similarly, whales with 100,000 to 1,000,000 coins have grown by two in the past four days.
Nonetheless, there is a chance that BAND bulls can’t hold the $7.4 level as, according to the IOMAP chart, they are also facing steep resistance between $9.04 and $9.29. Dropping below the $7.4 support level can quickly push Band Protocol price down to $6.
Note: All information on this page is subject to change. The use of this website constitutes acceptance of our user agreement. Please read our privacy policy and legal disclaimer. Opinions expressed at FXstreet.com are those of the individual authors and do not necessarily represent the opinion of FXstreet.com or its management. Risk Disclosure: Trading foreign exchange on margin carries a high level of risk, and may not be suitable for all investors. The high degree of leverage can work against you as well as for you. Before deciding to invest in foreign exchange you should carefully consider your investment objectives, level of experience, and risk appetite. The possibility exists that you could sustain a loss of some or all of your initial investment and therefore you should not invest money that you cannot afford to lose. You should be aware of all the risks associated with foreign exchange trading, and seek advice from an independent financial advisor if you have any doubts.
Recommended Content
Editors’ Picks

Polygon joins forces with WSPN to expand stablecoin adoption
WSPN, a stablecoin infrastructure company based in Singapore, has teamed up with Polygon Labs to make its stablecoin, WUSD, more useful in payment and decentralized finance.

Coinbase envisages listing of more meme coins amid regulatory optimism
Donald Trump's expected return to the White House creates excitement in the cryptocurrency sector, especially at Coinbase, the largest US-based crypto exchange. The platform is optimistic that the new administration will focus on regulatory clarity, which could lead to more token listings, including popular meme coins.

Cardano's ADA leaps to 2.5-year high of 90 cents as whale holdings exceed $12B
As Bitcoin (BTC) gets closer to the $100,000 mark for the first time — it crossed $99,000 earlier Friday — capital is rotating into alternative cryptocurrencies, creating a buzz in the broader crypto market.
Shiba Inu holders withdraw 1.67 trillion SHIB tokens from exchange
Shiba Inu trades slightly higher, around $0.000024, on Thursday after declining more than 5% the previous week. SHIB’s on-chain metrics project a bullish outlook as holders accumulate recent dips, and dormant wallets are on the move, all pointing to a recovery in the cards.

Bitcoin: Rally expected to continue as BTC nears $100K
Bitcoin (BTC) reached a new all-time high of $99,419, just inches away from the $100K milestone and has rallied over 9% so far this week. This bullish momentum was supported by the rising Bitcoin spot Exchange Traded Funds (ETF), which accounted for over $2.8 billion inflow until Thursday. BlackRock and Grayscale’s recent launch of the Bitcoin ETF options also fueled the rally this week.

Best Forex Brokers with Low Spreads
VERIFIED Low spreads are crucial for reducing trading costs. Explore top Forex brokers offering competitive spreads and high leverage. Compare options for EUR/USD, GBP/USD, USD/JPY, and Gold.