Band Protocol Price Analysis: Number of new addresses explodes by 4,600%
- BAND bulls face key resistance levels up top at the 50-day SMA and 100-day SMA.
- The downside is capped off by the $6.25 support wall.

Band Protocol is in the midst of a bullish rally, having jumped from $5.45 to $6.60 over the last three days. However, that’s not the most eye-raising statistic that one should be focussing on. As per IntoTheBlock “New Addresses” chart, the number of new addresses entering the protocol skyrocketed from 177 to 8,320, going up by 4,600% this Friday.
BAND new addresses
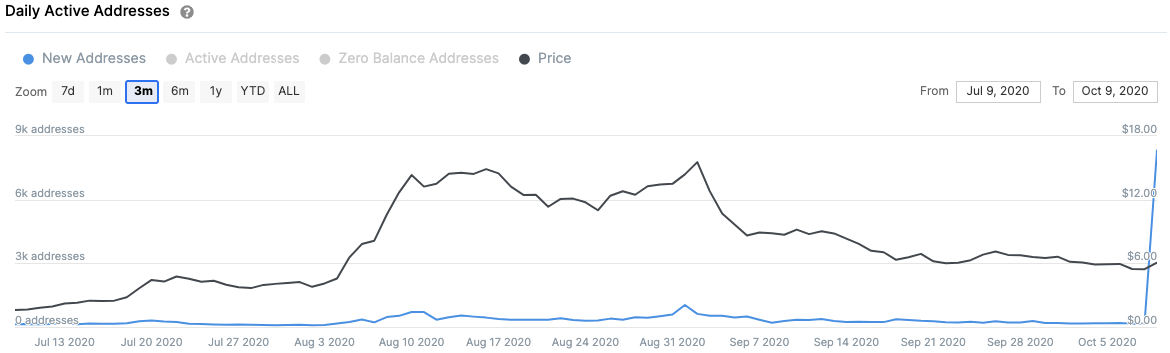
The number of new addresses entering the protocol is a heavily bullish sign. A rising network growth leads to a growth in price while declining network growth leads to decreasing prices. As of now, it is unsure as to what prompted this sudden spike. However, let’s look at how this affects the price.
BAND/USD daily chart
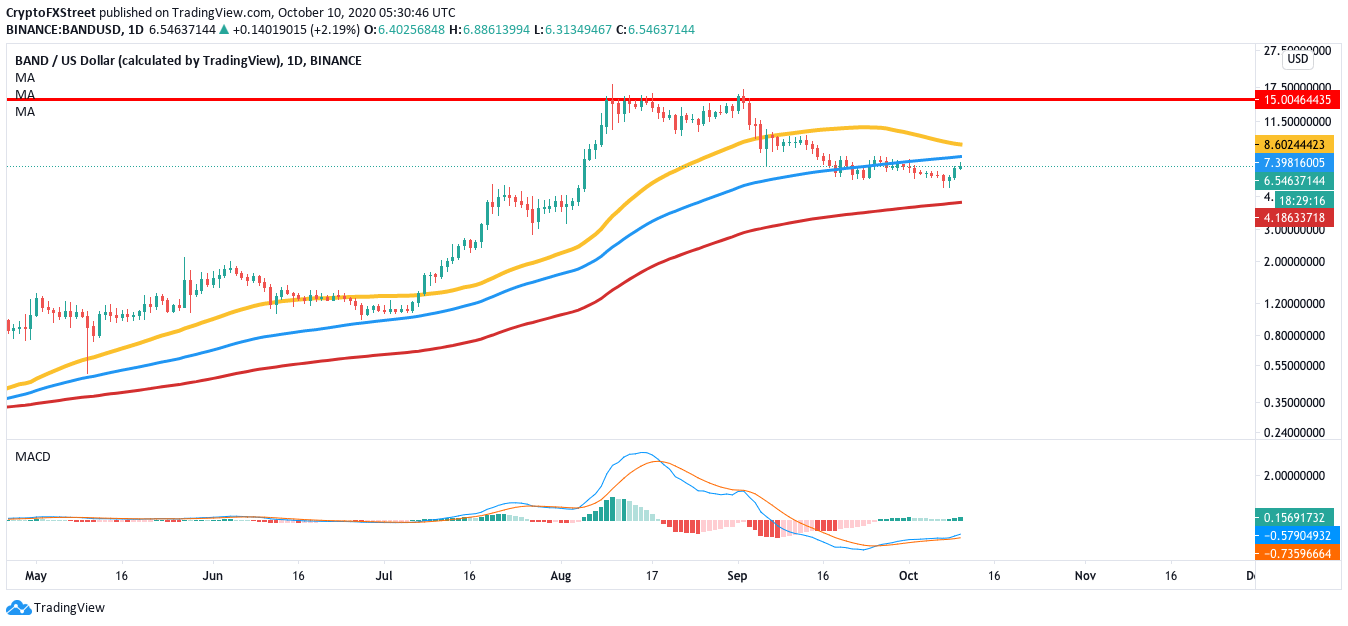
BAND/USD faces two strong resistance levels at the 100-day SMA ($7.40) and the 50-day SMA ($8.60). The MACD shows increasing bullish momentum, prompting the bulls to make an upward charge and break past these levels. As per IntoTheBlock’s IOMAP, the 100-day SMA presents a moderate-to-strong resistance wall.
BAND IOMAP
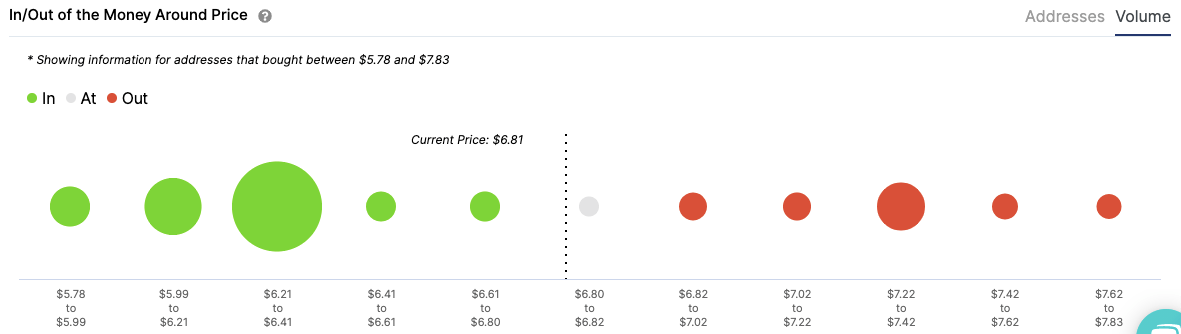
Previously at this level, 24 addresses had purchased almost 500,000 BAND tokens. If the buyers manage to break beyond this level, the price will rise upto the 50-day SMA ($8.60). If the buyers manage to break past this, it should surge the price all the way up to the all-time high levels at ~$15.
What if the bears take over?
The way the whales have been behaving recently may prompt a pullback by triggering a selling pressure. To visualize this, let’s check out Santiment’s holders distribution chart.
Ethereum holders distribution
 [11.07.04, 10 Oct, 2020]-637379061467004064.png)
As per the chart, the number of addresses holding at least 100,000 BAND dropped by a staggering 47% over the last two weeks. If this does trigger a pullback, it will push the price down to the $6.25 support level. As per the IOMAP, this is a solid support wall wherein 248 addresses had previously purchased a little over 3 million tokens. If the bears somehow manage to break below this level, they will be able to push the price down to the 200-day SMA ($4.20).
Key price levels to watch out for
If the bullish rally continues and the price breaks above the 100-day SMA ($7.40) and the 50-day SMA ($8.60), BAND will get a clear path to potentially reach all-time high levels ($~15). However, if the bears take control, their downside will be capped by the $6.25 support wall.
Author

Rajarshi Mitra
Independent Analyst
Rajarshi entered the blockchain space in 2016. He is a blockchain researcher who has worked for Blockgeeks and has done research work for several ICOs. He gets regularly invited to give talks on the blockchain technology and cryptocurrencies.