![]() Sheldon McIntyre, CMT
Sheldon McIntyre, CMT
Independent Analyst
- AXS price holds the 38.2% Fibonacci retracement level as the correction continues after a 647.49% gain in July.
- Volume profile through the current correction shows no hints of distribution, suggesting a bullish resolution.
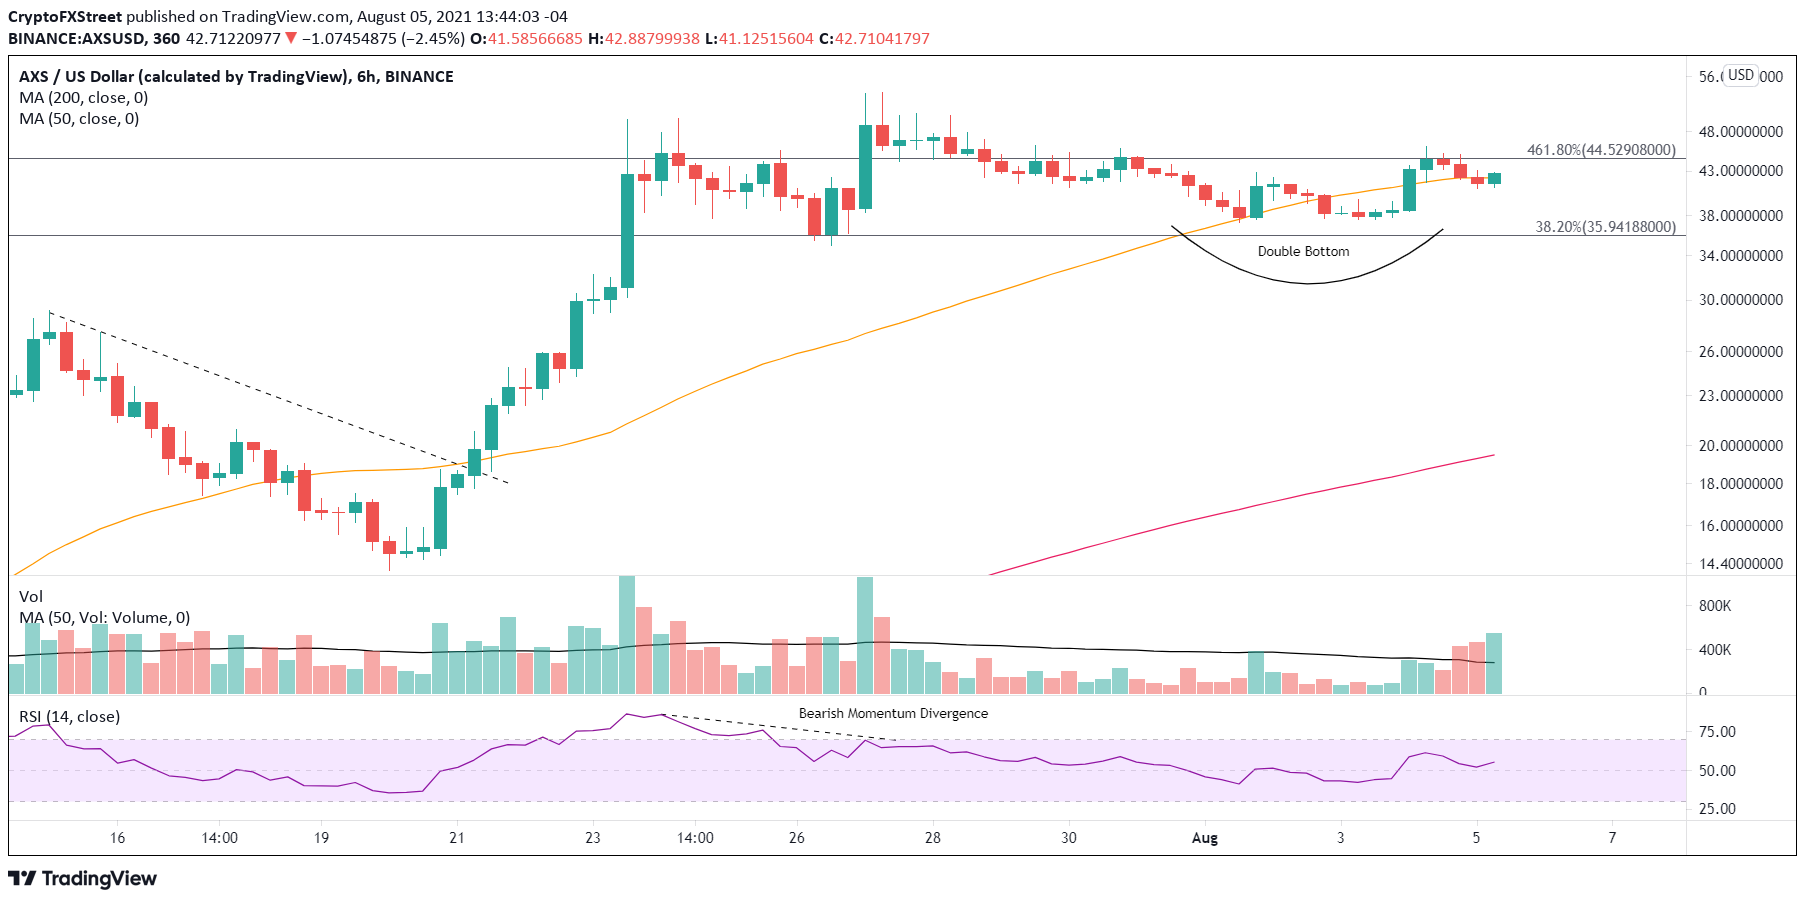
- Axie Infinity triggered a double bottom pattern on the six-hour chart and recaptured the support of the 50 six-hour simple moving average (SMA).
AXS price fell 13.91% last week after climbing 135.49% the previous week, demonstrating limited interest in the Axie Infinity investor ranks to capture profits. The resulting corrective process may have formed a low this week, with Axie Infinity triggering a double bottom pattern on the six-hour chart. Regardless of today’s weakness, the digital token is on the cusp of a new leg higher if it can disarm the magnet effect of the 461.8% extension of the cup base at $44.52 and the resistance of the measured move price target of $51.34.
AXS price encounters some turbulence, but investors show a firm grip
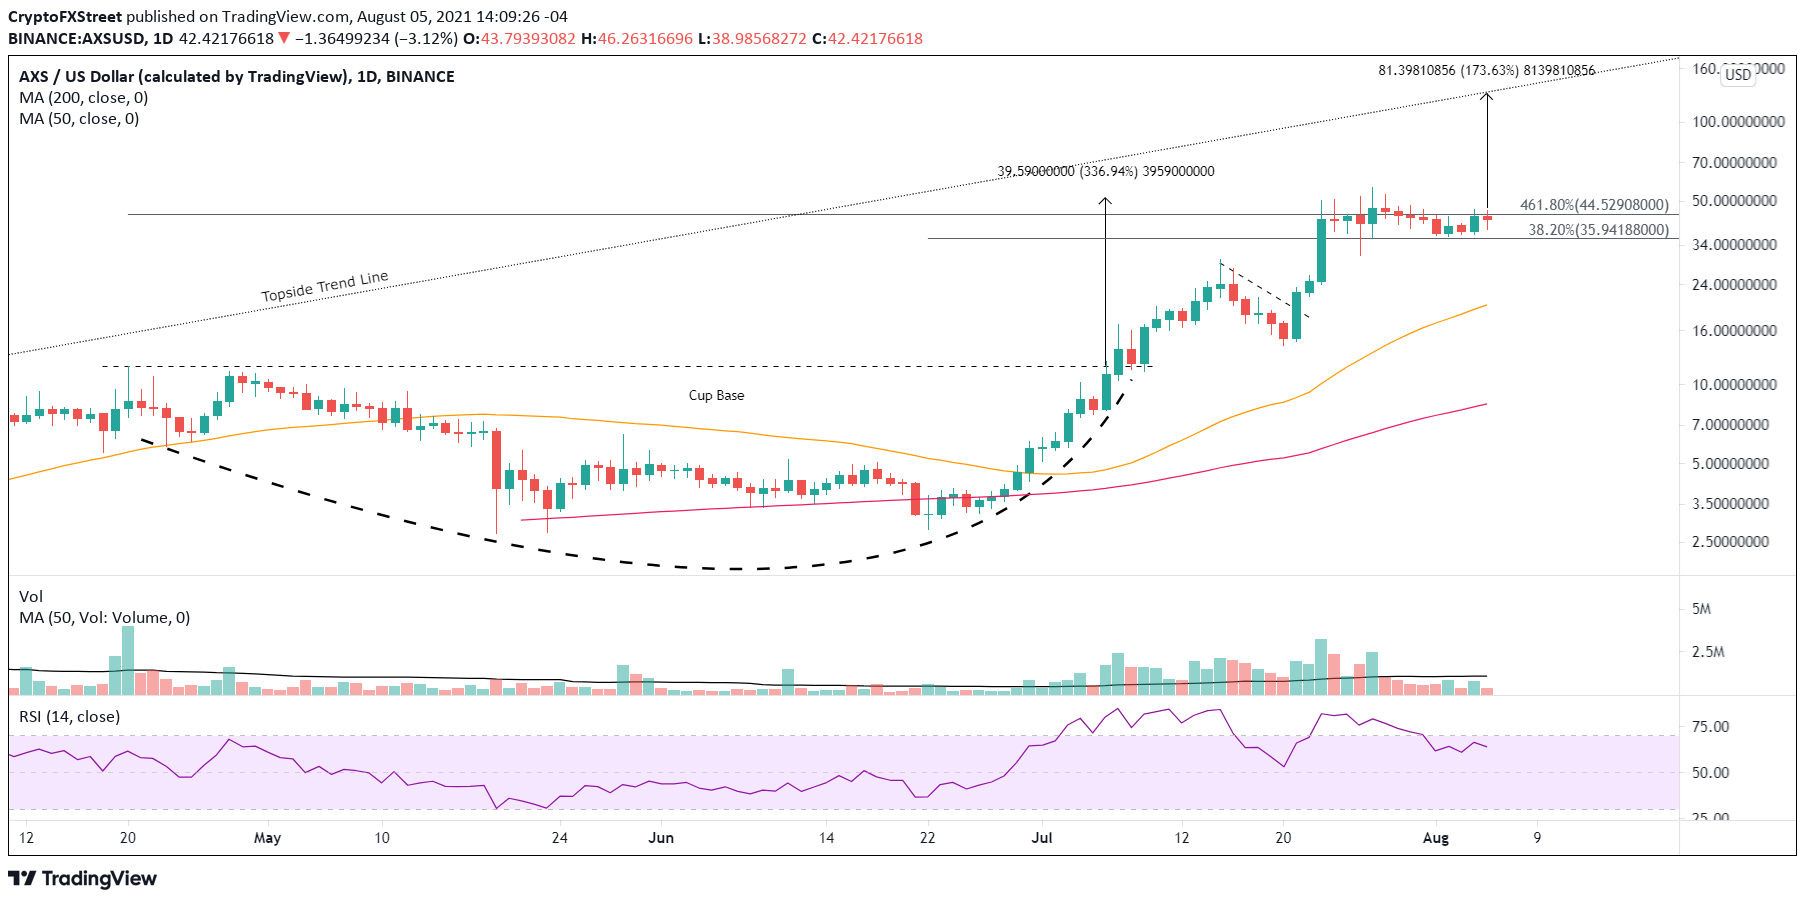
AXS price recorded one of the most dominant performances from the end of June to the end of July, driving the altcoin to a 1,800% gain and a test of the 461.8% extension of the April-May correction at $44.52 and the measured move target of the cup base formed from April to July at $51.34. After stalling around the measured move target, Axie Infinity printed several doji candlesticks and forged a correction, reflecting the indecision that commonly follows a tremendous gain.
When Axis Infinity tested the 261.8% extension of the April-May correction at $26.40, the cryptocurrency immediately fell into a correction that took the form of a flag pattern. Thus, pullbacks are inevitable when significant AXS price levels are probed.
However, the corrective process may be completed as AXS price logged a breakout from a double bottom on the six-hour chart on August 3 and recaptured the essential intra-day support provided by the 50 six-hour SMA at $42.16.
AXS/USD daily chart
The AXS price indecision over the last 13 sessions following the test of the 461.8% extension has held the 38.2% retracement of the advance from the June 22 low at $35.94, which is highlighted by a sharp contraction in volume, signifying no distribution or eagerness to capture profits.
With the double bottom already activated on the six-hour chart, AXS price needs to log a daily close above the July 27 close of $46.88 for Axie Infinity to actively target new rally highs, including a touch of the topside trend line going back to the November 2020 high at $128.27, delivering a 173.63% return from the July 27 close.
AXS/USD daily chart
The bullish narrative will be voided with a daily close below the 38.2% retracement at $32.94. It may project a deeper correction or mark a definitive top for AXS price.
AXS price has not been overwhelmed by a rush for the exits, despite the historic gains. Axie Infinity has preferred a slow drift lower, evacuating the weak holders, releasing the price compression, allowing the shorter duration moving averages to catch up and formalizing the base for a resumption of the advance.
With AXS price close to the entry price of $46.88, Axie Infinity investors need to prepare for a quick thrust higher. Whether the altcoin reaches the topside trend line is unknown, but AXS price can manufacture the momentum to come close based on historical precedent.
Here, FXStreet's analysts evaluate where AXS could be heading next as it seems bound to advance further.
Note: All information on this page is subject to change. The use of this website constitutes acceptance of our user agreement. Please read our privacy policy and legal disclaimer. Opinions expressed at FXstreet.com are those of the individual authors and do not necessarily represent the opinion of FXstreet.com or its management. Risk Disclosure: Trading foreign exchange on margin carries a high level of risk, and may not be suitable for all investors. The high degree of leverage can work against you as well as for you. Before deciding to invest in foreign exchange you should carefully consider your investment objectives, level of experience, and risk appetite. The possibility exists that you could sustain a loss of some or all of your initial investment and therefore you should not invest money that you cannot afford to lose. You should be aware of all the risks associated with foreign exchange trading, and seek advice from an independent financial advisor if you have any doubts.
Recommended Content
Editors’ Picks

Shiba Inu eyes positive returns in April as SHIB price inches towards $0.000015
Shiba Inu's on-chain metrics reveal robust adoption, as addresses with balances surge to 1.4 million. Shiba Inu's returns stand at a solid 14.4% so far in April, poised to snap a three-month bearish trend from earlier this year.

AI tokens TAO, FET, AI16Z surge despite NVIDIA excluding crypto-related projects from its Inception program
AI tokens, including Bittensor and Artificial Superintelligence Alliance, climbed this week, with ai16z still extending gains at the time of writing on Friday. The uptick in prices of AI tokens reflects a broader bullish sentiment across the cryptocurrency market.

Bitcoin Weekly Forecast: BTC consolidates after posting over 10% weekly surge
Bitcoin price is consolidating around $94,000 at the time of writing on Friday, holding onto the recent 10% increase seen earlier this week. This week’s rally was supported by strong institutional demand, as US spot ETFs recorded a total inflow of $2.68 billion until Thursday.

XRP price could renew 25% breakout bid on surging institutional and retail adoption
Ripple price consolidates, trading at $2.18 at the time of writing on Friday, following mid-week gains to $2.30. The rejection from this weekly high led to the price of XRP dropping to the previous day’s low at $2.11, followed by a minor reversal.
Bitcoin Weekly Forecast: BTC consolidates after posting over 10% weekly surge
Bitcoin (BTC) price is consolidating around $94,000 at the time of writing on Friday, holding onto the recent 10% increase seen earlier this week.

The Best brokers to trade EUR/USD
SPONSORED Discover the top brokers for trading EUR/USD in 2025. Our list features brokers with competitive spreads, fast execution, and powerful platforms. Whether you're a beginner or an expert, find the right partner to navigate the dynamic Forex market.