- Axie Infinity slips below the essential technical support area.
- AXS could see another correction between 16% and 30%.
- When bulls can build on upbeat global sentiment, expect a recovery back above $85.
Axie Infinity (AXS) is in rough shape after an acceleration of the downtrend at the beginning of the year. Investors are not showing their hand, reflected in the Relative Strength Index (RSI) trading firmly in the oversold area with no real bullish knee-jerk reactions. As the price this morning firmly opens below $70, it looks as though bulls have given way to sellers which could see AXS price hitting $60 in the process.
AXS price action sees bulls fleeing with more losses to come
Axie Infinity looks to say goodbye to the $70-area for now. Although the historical level at $73 and the monthly S1 support level around $70 look very promising and make sense as an entry for a long, price action gaped open lower this Tuesday, with bulls now facing the elements mentioned above in the form of resistance capping any further upside for now. As investors do not have a profit target and incentive in sight, expect AXS price action to look for support further down the line, offered around $60.
AXS could thus be going against the mainstream recovery that we are seeing today, but that would also fit as a reason for AXS price action not dipping further towards $50, as the RSI is already quite far in oversold territory already, thus limiting any further gains for sellers. With the tailwinds from the broad recovery in global markets, AXS will not see a sharp accelerated decline since the positive ambience will likely set a break or slowdown on the decline.
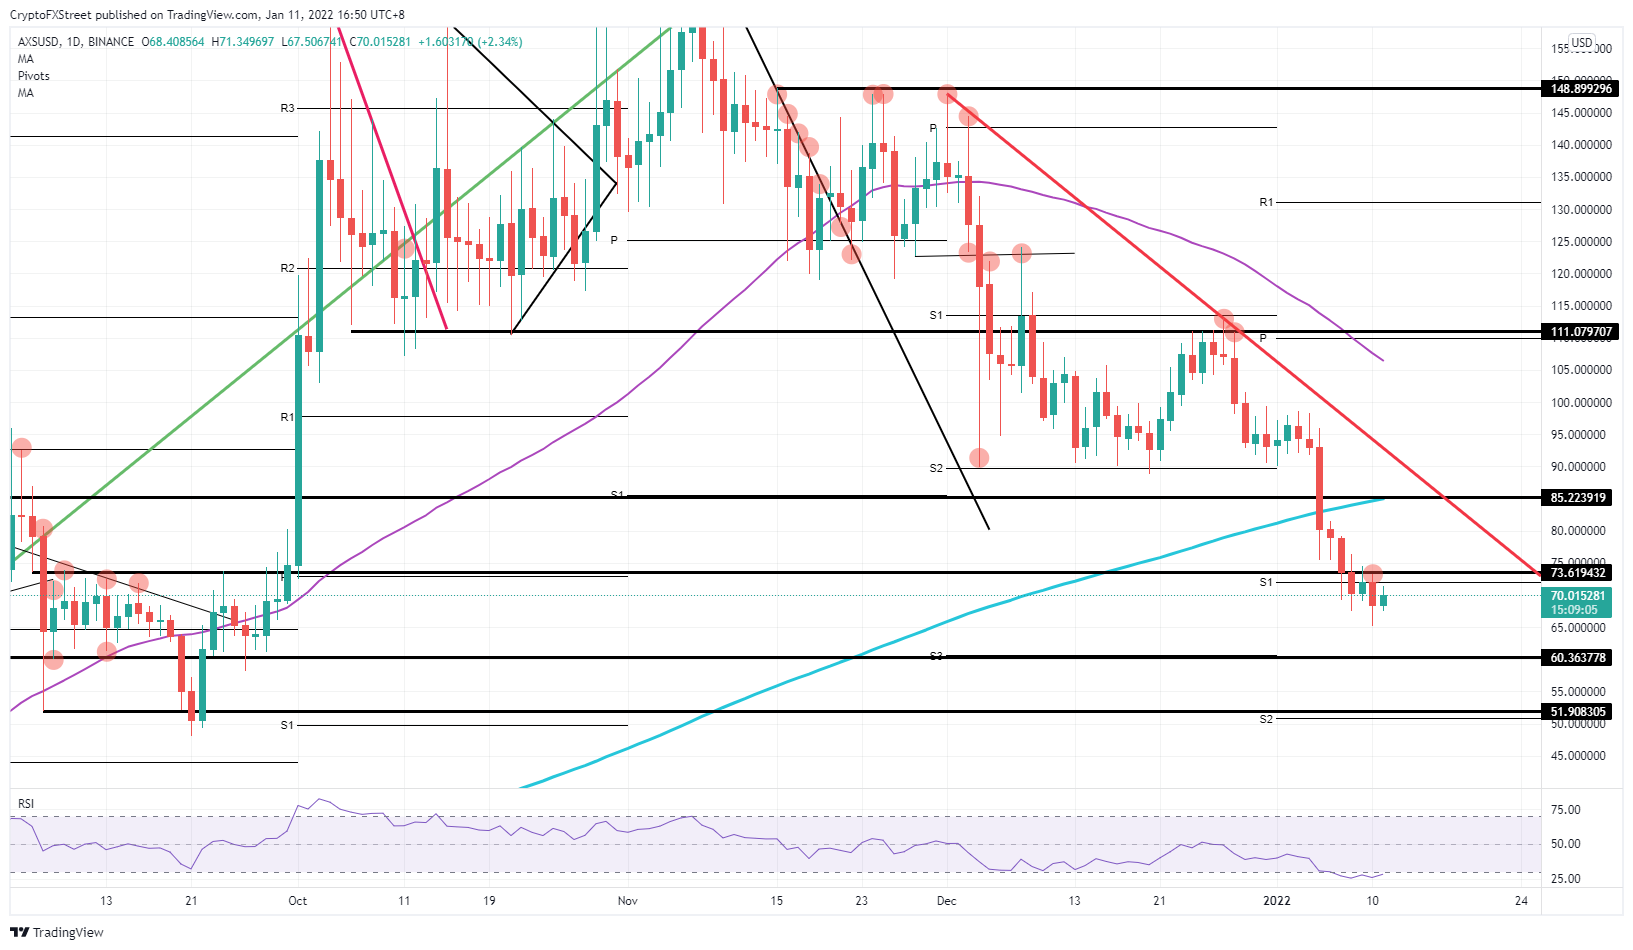
AXS/USD daily chart
Hopes that Axie Infinity price could still swing back above $75 are not unfounded if the current tailwinds kick in with a delayed effect once investors decide to re-engage with cryptocurrencies. A break above $73 would see a broad pickup in demand on buying volume and would see an accelerated move back towards $85, where the 200-day Simple Moving Average (SMA) comes into play together with a historical level. Expect this to be an area for a pause and some profit-taking, depending on the strength of the tailwinds, before AXS price mounts an attack and possible breakout above December 01’s red descending trend line.
Information on these pages contains forward-looking statements that involve risks and uncertainties. Markets and instruments profiled on this page are for informational purposes only and should not in any way come across as a recommendation to buy or sell in these assets. You should do your own thorough research before making any investment decisions. FXStreet does not in any way guarantee that this information is free from mistakes, errors, or material misstatements. It also does not guarantee that this information is of a timely nature. Investing in Open Markets involves a great deal of risk, including the loss of all or a portion of your investment, as well as emotional distress. All risks, losses and costs associated with investing, including total loss of principal, are your responsibility. The views and opinions expressed in this article are those of the authors and do not necessarily reflect the official policy or position of FXStreet nor its advertisers. The author will not be held responsible for information that is found at the end of links posted on this page.
If not otherwise explicitly mentioned in the body of the article, at the time of writing, the author has no position in any stock mentioned in this article and no business relationship with any company mentioned. The author has not received compensation for writing this article, other than from FXStreet.
FXStreet and the author do not provide personalized recommendations. The author makes no representations as to the accuracy, completeness, or suitability of this information. FXStreet and the author will not be liable for any errors, omissions or any losses, injuries or damages arising from this information and its display or use. Errors and omissions excepted.
The author and FXStreet are not registered investment advisors and nothing in this article is intended to be investment advice.
Recommended Content
Editors’ Picks

Ethereum Price Forecast: ETH consolidates below $2,000 as Standard Chartered alters its prediction for 2025
Ethereum remained just below $2,000 in the Asian session on Tuesday as Standard Chartered's Global Head of Digital Assets Research, Geoffrey Kendrick, updated the bank's 2025 price forecast for ETH.

Solana price faces 50-day resistance as SOL futures debut on CME Group with $5M volume on fifth anniversary
Solana (SOL) stagnated around the $128 mark on Monday despite multiple bullish catalysts. The recent SOL unlocks by Alameda Research, ahead of FTX creditor repayments, have created a persistent bearish overhang since early March.

Canary Capital proposes first-ever Sui ETF following S-1 filing with the SEC
SUI saw slight gains on Monday as Canary Capital submitted an S-1 application with the Securities & Exchange Commission (SEC) to launch a Sui exchange-traded fund (ETF). This adds to the growing list of altcoin ETF filings awaiting approvals from the regulator.

Outflows in crypto funds reach $6.4 billion over five weeks amid long-term holder accumulation
Crypto exchange-traded funds (ETFs) extended their outflow streak last week, totaling $1.7 billion, bringing the total outflows in the past 5 weeks to $6.4 billion, per CoinShares weekly report on Monday.

Bitcoin: BTC at risk of $75,000 reversal as Trump’s trade war overshadows US easing inflation
Bitcoin price remained constrained within a tight 8% channel between $76,000 and $84,472 this week. With conflicting market catalysts preventing prolonged directional swings, here are key factors that moved BTC prices this week, as well as key indicators to watch in the weeks ahead.

The Best brokers to trade EUR/USD
SPONSORED Discover the top brokers for trading EUR/USD in 2025. Our list features brokers with competitive spreads, fast execution, and powerful platforms. Whether you're a beginner or an expert, find the right partner to navigate the dynamic Forex market.