Axie Infinity Price Prediction: AXS stares at 30% correction
- Axie Infinity price retraced 29% from its all-time high at $49.68 and is attempting another leg-up.
- AXS is likely to correct another 30% to $28.12 from its current position before a new uptrend.
- A decisive 12-hour candlestick close above the all-time high at $49.68 will invalidate the bearish outlook.
Axie Infinity price is currently experiencing a pullback as it underwent another exponential upswing. The resulting retracement could extend up to the trading range’s mid-point before new leg-up kick-starts.
Axie Infinity price awaits catalyst
Axie Infinity price rallied from $2.8 to $29 in 22 days and experienced a sharp 50% pullback. This downswing was followed by another exponential 252% upswing to a new all-time high at $49.68.
Interestingly, the Momentum Reversal Indicator (MRI) flashed a sell signal in the form of a red ‘one’ candlestick, indicating that the reversal in trend is likely. This technical setup forecasts a one-to-four candlestick correction.
Although the bulls seem to have disregarded this sell signal, the downswing will eventually come if Bitcoin price continues to retrace.
The $34.88 level is the first line of defense. Breaching this barrier will push AXS down to $28.12, extremely close to the 50% Fibonacci retracement level at $26.30. A move to $26.30 would constitute a 30% crash from the current position, $41.25.
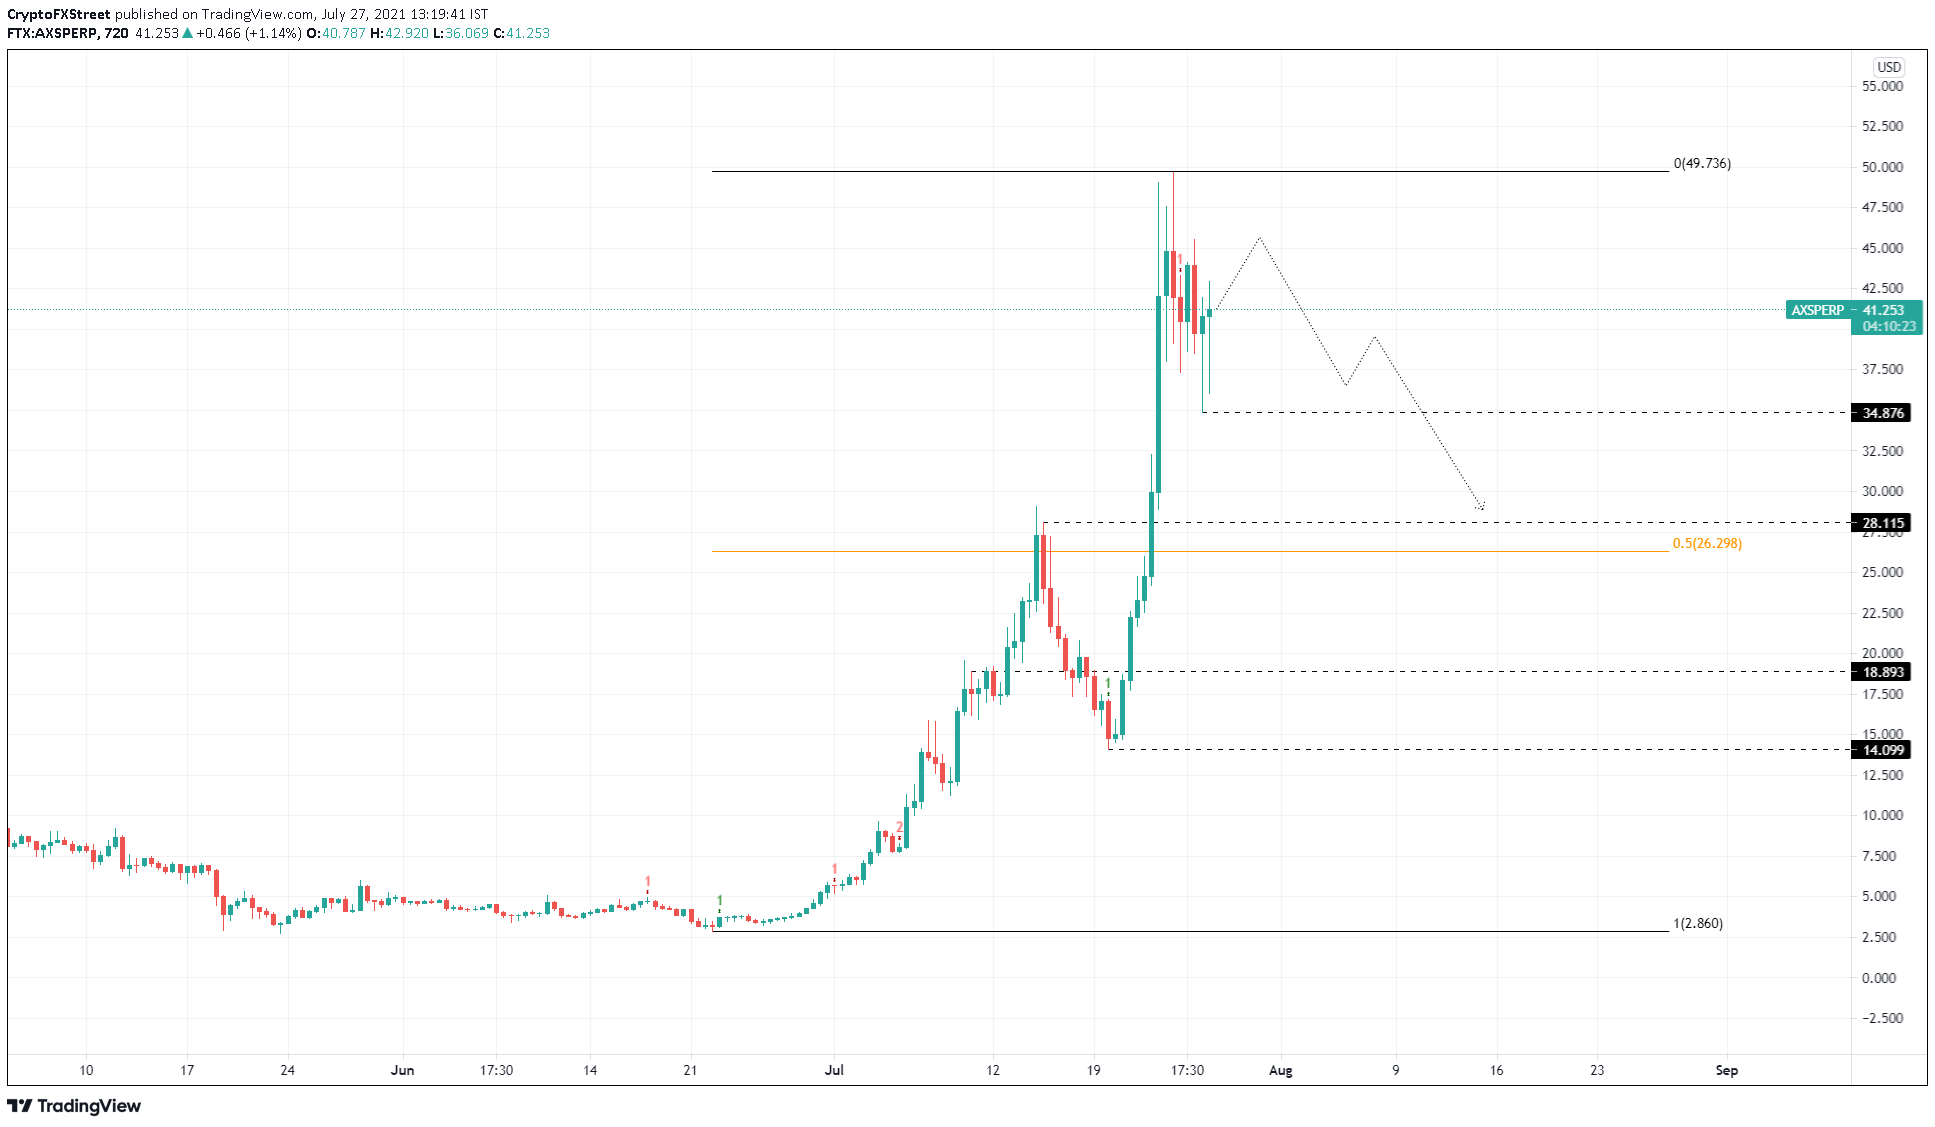
AXS/USDT 12-hour chart
Investors can expect a reversal around $28.12 or $26.30, leading to a new run-up, which could potentially retest the all-time high at $49.68.
However, if the correction shatters $26.30, it will invalidate this bullish thesis and trigger a potential 28% downtrend to $18.29.
Author

Akash Girimath
FXStreet
Akash Girimath is a Mechanical Engineer interested in the chaos of the financial markets. Trying to make sense of this convoluted yet fascinating space, he switched his engineering job to become a crypto reporter and analyst.