![]() Sarah Tran
Sarah Tran
Independent Analyst
- Axie Infinity price is at risk of sliding further toward $30 as buyers are nowhere to be found.
- A few lines of defense may emerge before AXS hits the pessimistic target.
- The bulls will face a stiff hurdle at $67.83 if buying pressure increases.
Axie Infinity price continues to face weakness as its downtrend remains intact. AXS could be headed for a 40% plunge following the slice below the lower boundary of the prevailing chart pattern.
Axie Infinity price paralyzed by bearish momentum
Axie Infinity price validated the descending parallel channel when the token broke below the lower boundary of the governing technical pattern at $58.08 on January 22. The prevailing chart pattern projects a 40% plunge toward the $30.30, coinciding with the 127.2% Fibonacci extension level.
The first line of defense for Axie Infinity price is at the September 21 low at $48.10. An additional foothold will emerge at the August 10 low at $43.29. Before AXS drops toward the pessimistic target, another line of support may appear at the August 1 low at $37.26.
However, if buying pressure increases, Axie Infinity price may aim to tag the lower boundary of the governing technical pattern at $55.76 first.
An uptick in market sentiment may incentivize the bulls to reach the 78.6% Fibonacci retracement level at $61.12, then toward the middle boundary of the prevailing chart pattern at $67.83, coinciding with the 21-day Simple Moving Average (SMA).
Bigger aspirations will target the upper boundary of the descending parallel channel at $79.26, which intersects with the 50% retracement level.
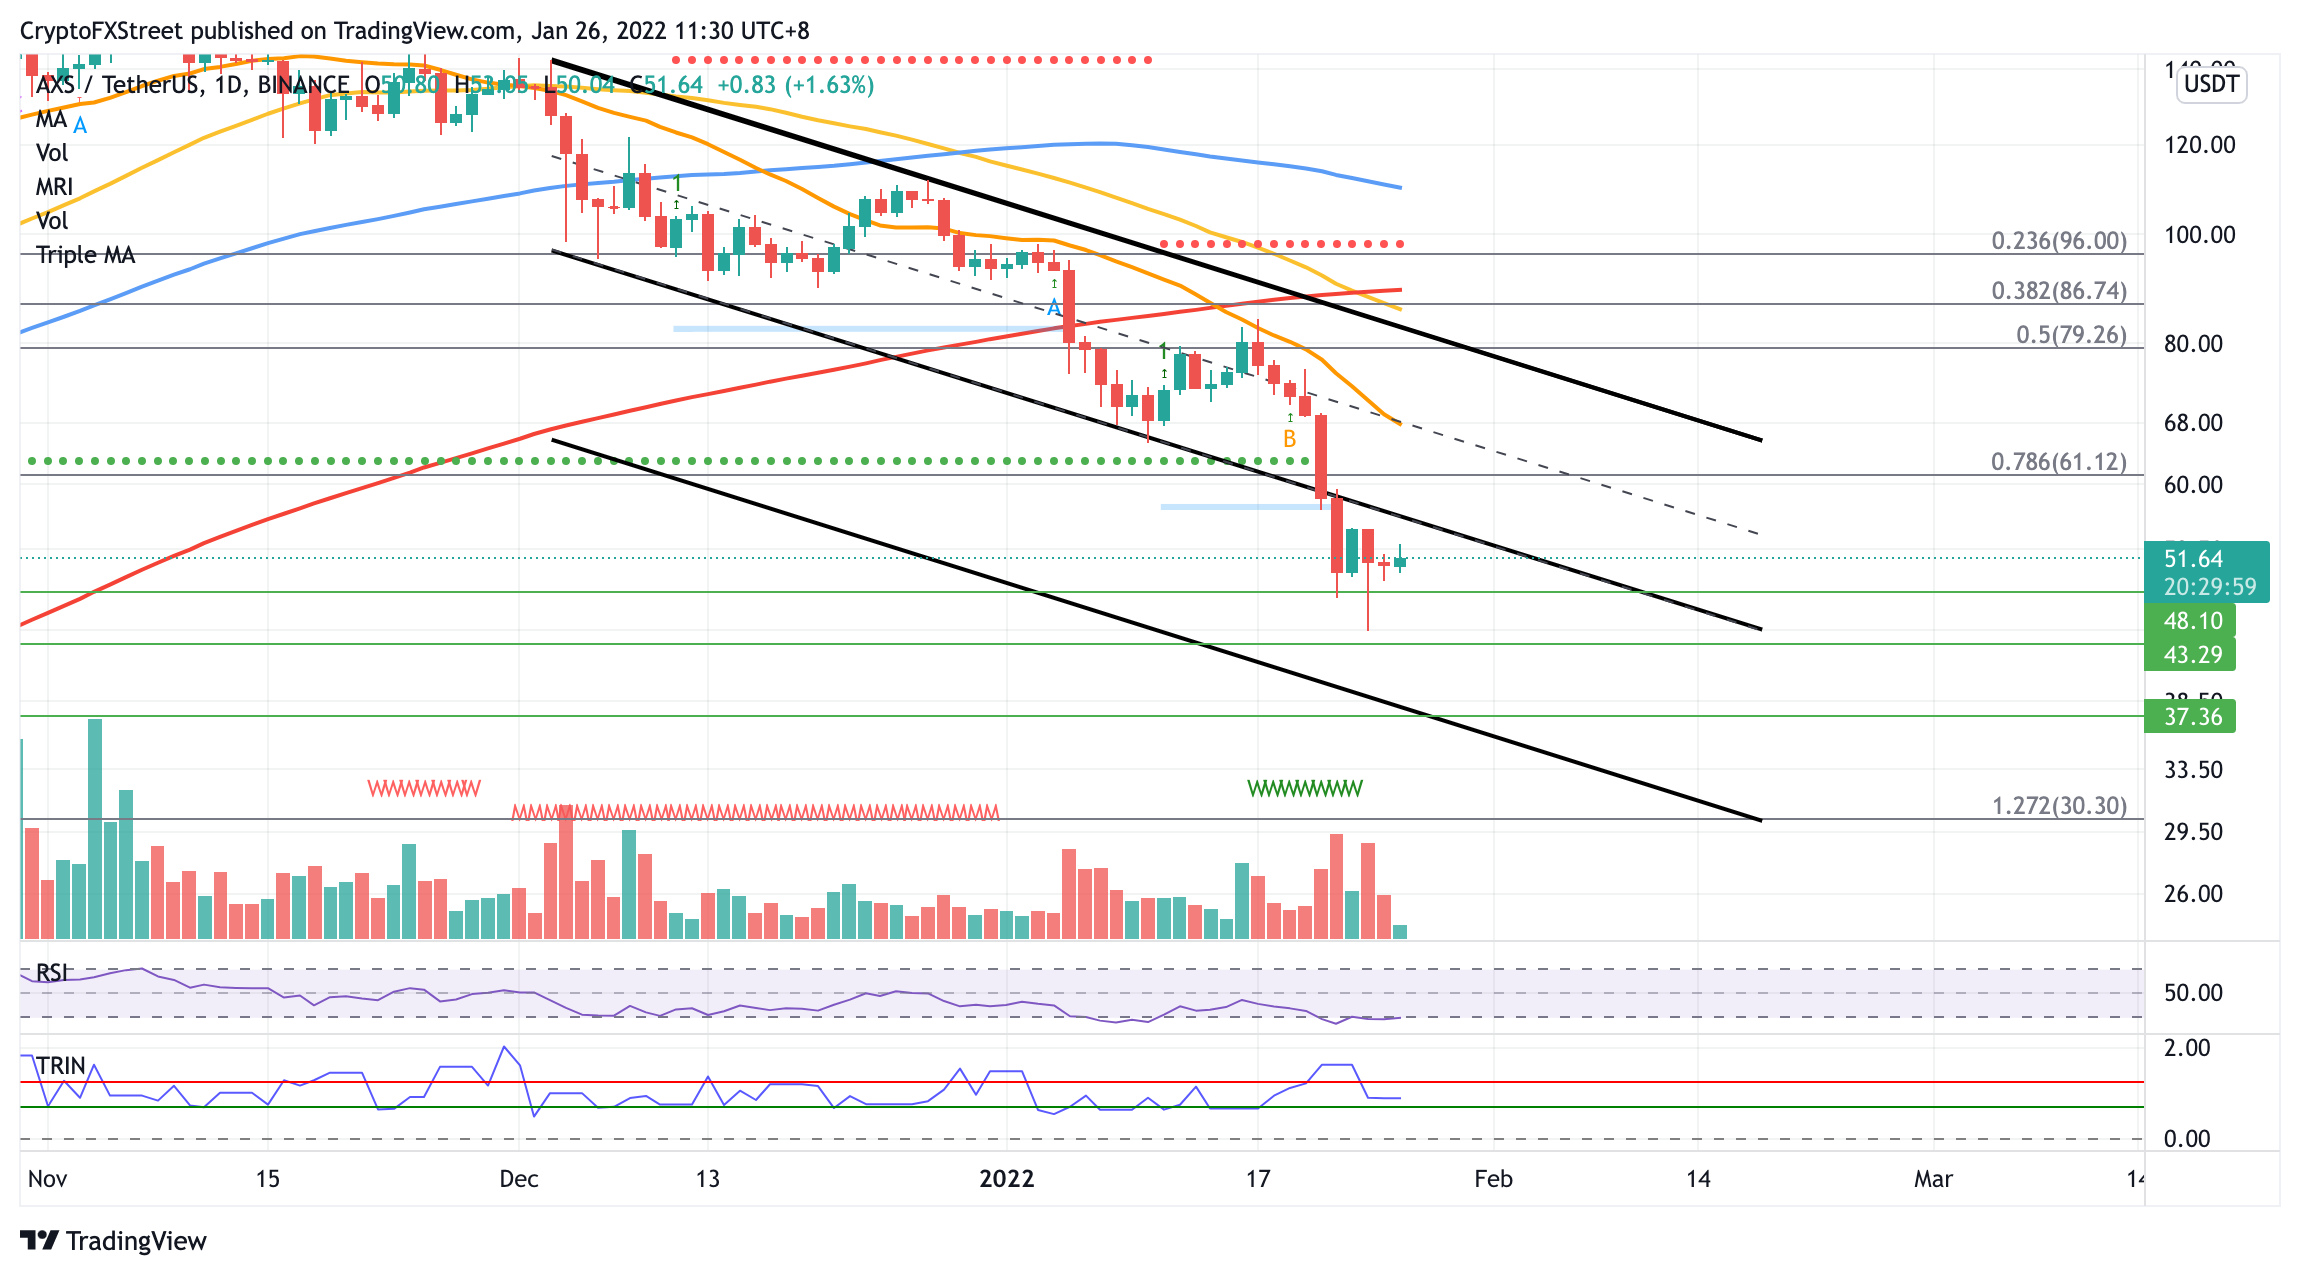
AXS/USDT daily chart
Only if Axie Infinity price manages to escape above the topside trend line of the governing technical pattern would see AXS break free from the prevailing downtrend.
However, bullish investors should note that Axie Infinity price would still face stiff resistance following a potential break above the upper boundary of the parallel channel. AXS will face significant challenges at the 38.2% Fibonacci retracement level at $86.74, sitting near the 50-day SMA and 200-day SMA.
Note: All information on this page is subject to change. The use of this website constitutes acceptance of our user agreement. Please read our privacy policy and legal disclaimer. Opinions expressed at FXstreet.com are those of the individual authors and do not necessarily represent the opinion of FXstreet.com or its management. Risk Disclosure: Trading foreign exchange on margin carries a high level of risk, and may not be suitable for all investors. The high degree of leverage can work against you as well as for you. Before deciding to invest in foreign exchange you should carefully consider your investment objectives, level of experience, and risk appetite. The possibility exists that you could sustain a loss of some or all of your initial investment and therefore you should not invest money that you cannot afford to lose. You should be aware of all the risks associated with foreign exchange trading, and seek advice from an independent financial advisor if you have any doubts.
Recommended Content
Editors’ Picks

Whale grabs 16,000 ETH as Ethereum Foundation vows support for L1, RWA and stablecoins
Ethereum Foundation's Co-Executive Director Tomasz K. Stańczak highlights simplified roadmap scaling blobs and improving L1 performance. Ethereum whale scoops 16,000 ETH, emphasizing growing interest in the token as the price recovers.

Bitcoin retests key resistance at $85K, breakout to $90K or rejection to $78K?
Bitcoin (BTC) price edges higher and approaches its key resistance at $85,000 on Monday, with a breakout indicating a bullish trend ahead. Metaplanet announced Monday that it purchased an additional 319 BTC, bringing its total holdings to 4,525 BTC.

XRP price teases breakout, bulls defend $2 support
Ripple (XRP) price grinds higher and trades at $2.15 during the early European session on Monday. The token sustained a bullish outlook throughout the weekend supported by bullish sentiment from the 90-day tariff suspension in the United States.

Senator Elizabeth Warren launches fresh offensive on crypto
Senators Elizabeth Warren, Mazie K. Hirono, and Dick Durbin want the DoJ’s decision to terminate crypto investigations reversed. The Senators raise concerns over the DoJ’s shift in priorities, terming it a “grave mistake.”

Bitcoin Weekly Forecast: Market uncertainty lingers, Trump’s 90-day tariff pause sparks modest recovery
Bitcoin (BTC) price extends recovery to around $82,500 on Friday after dumping to a new year-to-date low of $74,508 to start the week. Market uncertainty remains high, leading to a massive shakeout, with total liquidations hitting $2.18 billion across crypto markets.

The Best brokers to trade EUR/USD
SPONSORED Discover the top brokers for trading EUR/USD in 2025. Our list features brokers with competitive spreads, fast execution, and powerful platforms. Whether you're a beginner or an expert, find the right partner to navigate the dynamic Forex market.