Axie Infinity price has more room to crash before uptrend signs emerge
- Axie Infinity price has slid 48% from its all-time high at $29.09.
- While further descent seems plausible, investors should note that an uptrend could originate from its current position – $15.38.
- Despite this massive sell-off, AXS might drop at least 12% before bulls come to the rescue.

Axie Infinity price has witnessed a steep correction after an exponential rally. Following a massive downtrend, AXS is nearly close to bouncing off a stable support level. However, this barrier is below the current position, suggesting that the altcoin might head lower.
Axie Infinity price scrambles to find foothold
Axie Infinity price rallied roughly 917% between June 22 and July 15 to hit a new all-time high of $29.09. As impressive as this uptrend was, the 48% downswing that followed it was extremely steep.
AXS is currently trading at $15.38 and could potentially reverse its down move. However, investors should not neglect the possibility of a retest of the support level at $13.57. In some cases, a breakdown of this barrier could push AXS down to the high probability reversal zone extending from $12.84 to $8.38.
Assuming Axie Infinity pulls a 180 at $12.84, the first point of resistance will be the range’s midpoint at $15.98.
A decisive daily candlestick close above it will prove the buyers’ intention and propel the altcoin up by 23% to tag the swing high at $19.55.
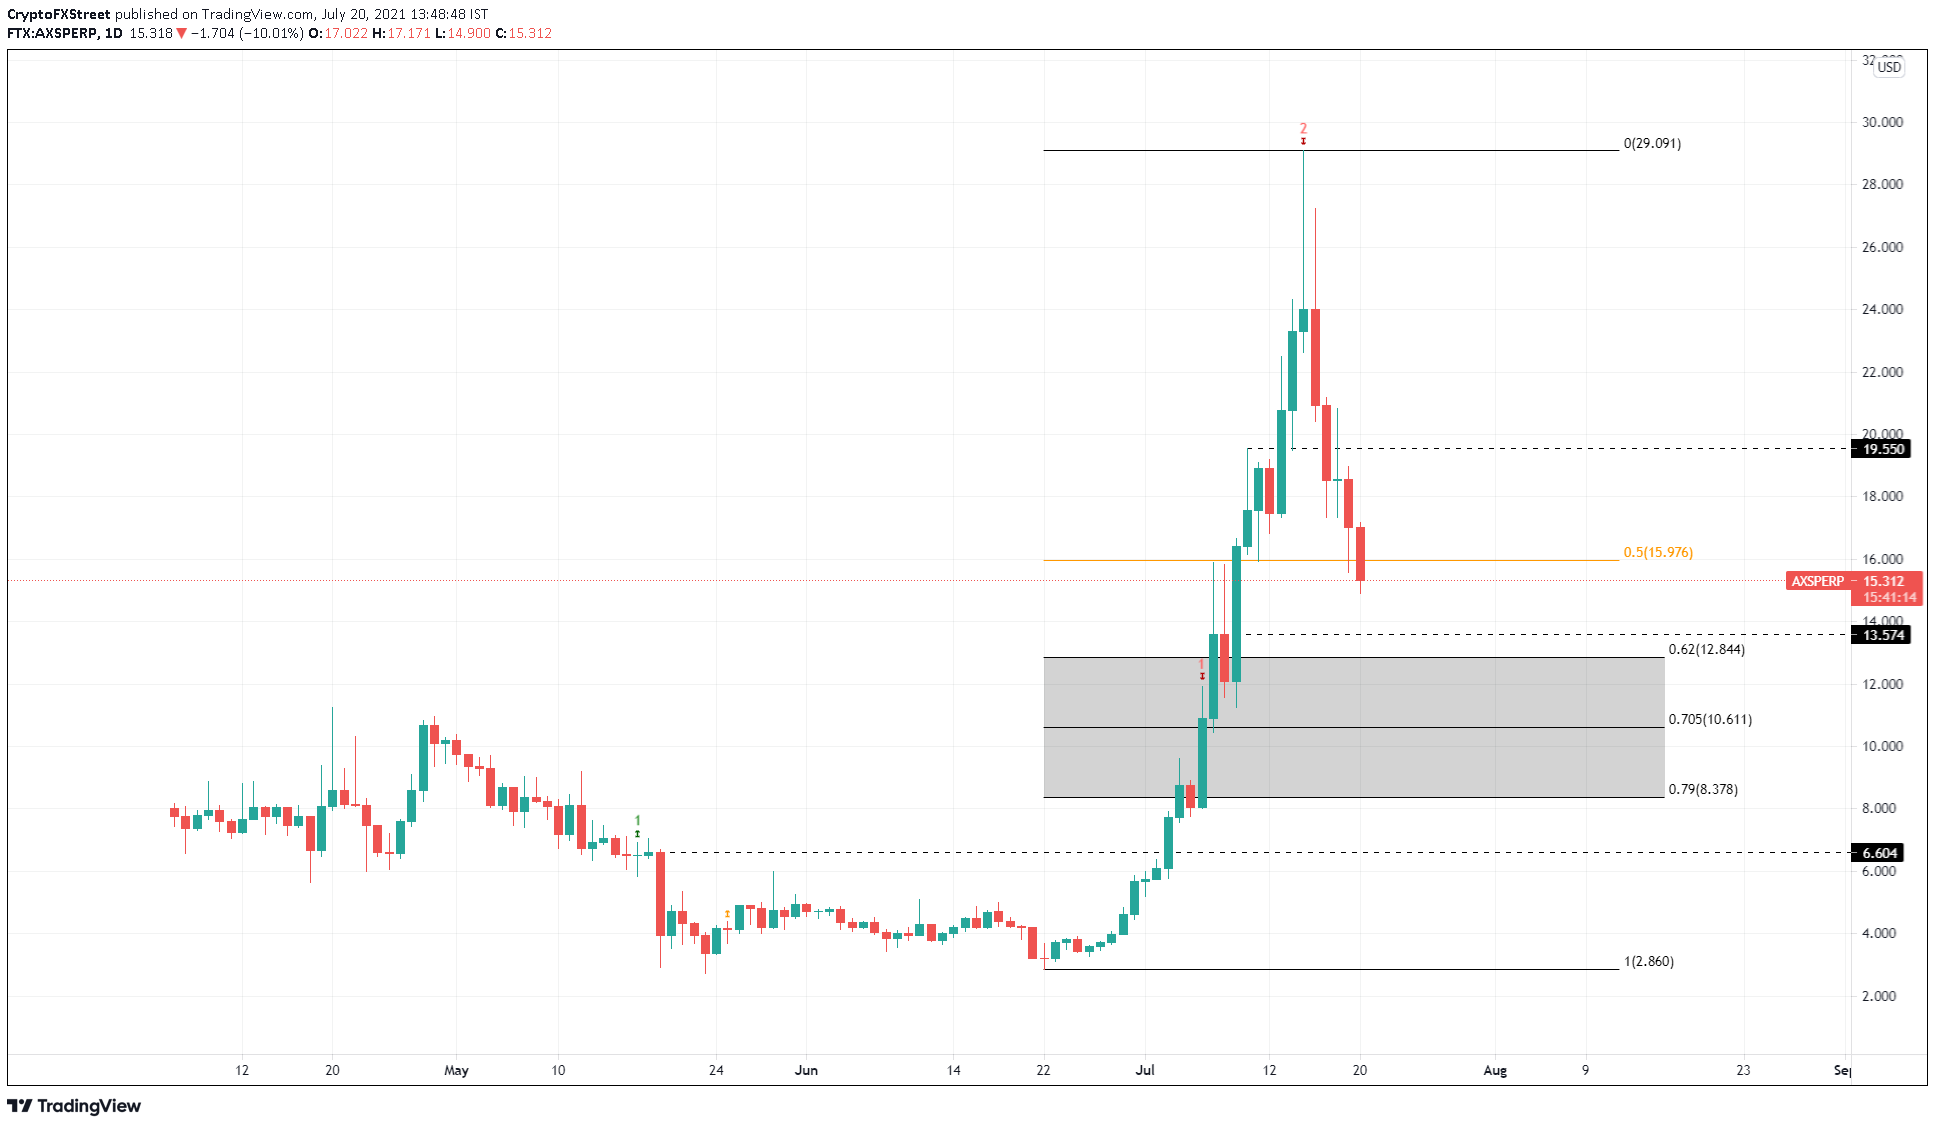
AXS/USDT 1-day chart
On the flip side, if Axie Infinity price slices through the 70.5% Fibonacci retracement level at $10.61, it will indicate that the sellers are in control. A breakdown of the subsequent support floor at $8.38 will invalidate the bullish thesis though.
In such a case, AXS could slowly head toward the $6.60 demand barrier.
Author

Akash Girimath
FXStreet
Akash Girimath is a Mechanical Engineer interested in the chaos of the financial markets. Trying to make sense of this convoluted yet fascinating space, he switched his engineering job to become a crypto reporter and analyst.


