AVAX price exhaustion could lead to sizeable retracement, but for the better
- AVAX price seems to be having trouble overcoming the $30.20 hurdle after multiple attempts.
- A rejection here could likely lead to an 8% to 14% retracement in the near future.
- A daily candlestick close below $26.34 without a quick recovery will trigger a bearish scenario for Avalanche.

AVAX price is in a no man’s land and depending on how the altcoin reacts to a few barriers, investors can bet on its direction. But a minor retracement in the short-term seems likely given the current market conditions.
AVAX price needs to find stable support levels
AVAX price has rallied 126% since June 19 and 39% since August 3. This impressive rally comes after the altcoin managed to get back into the $22.43 to $37.97 range that was created in May 2022.
However, the upswing has been facing issues overcoming the midpoint of this range at $30.20 since August 8. Due to the expansive move that AVAX price has undergone, a minor retracement seems likely.
Investors can expect AVAX price to retrace to the immediate support level at $26.34 or dig a little deeper and retest the $24.71 barrier. While the overall consensus on altcoins is bullish, investors can expect another attempt at overcoming the $30.20 hurdle if the bulls allow a quick recovery above $26.34.
Failing to do so will indicate that the profit-taking or the selling pressure is taking over.
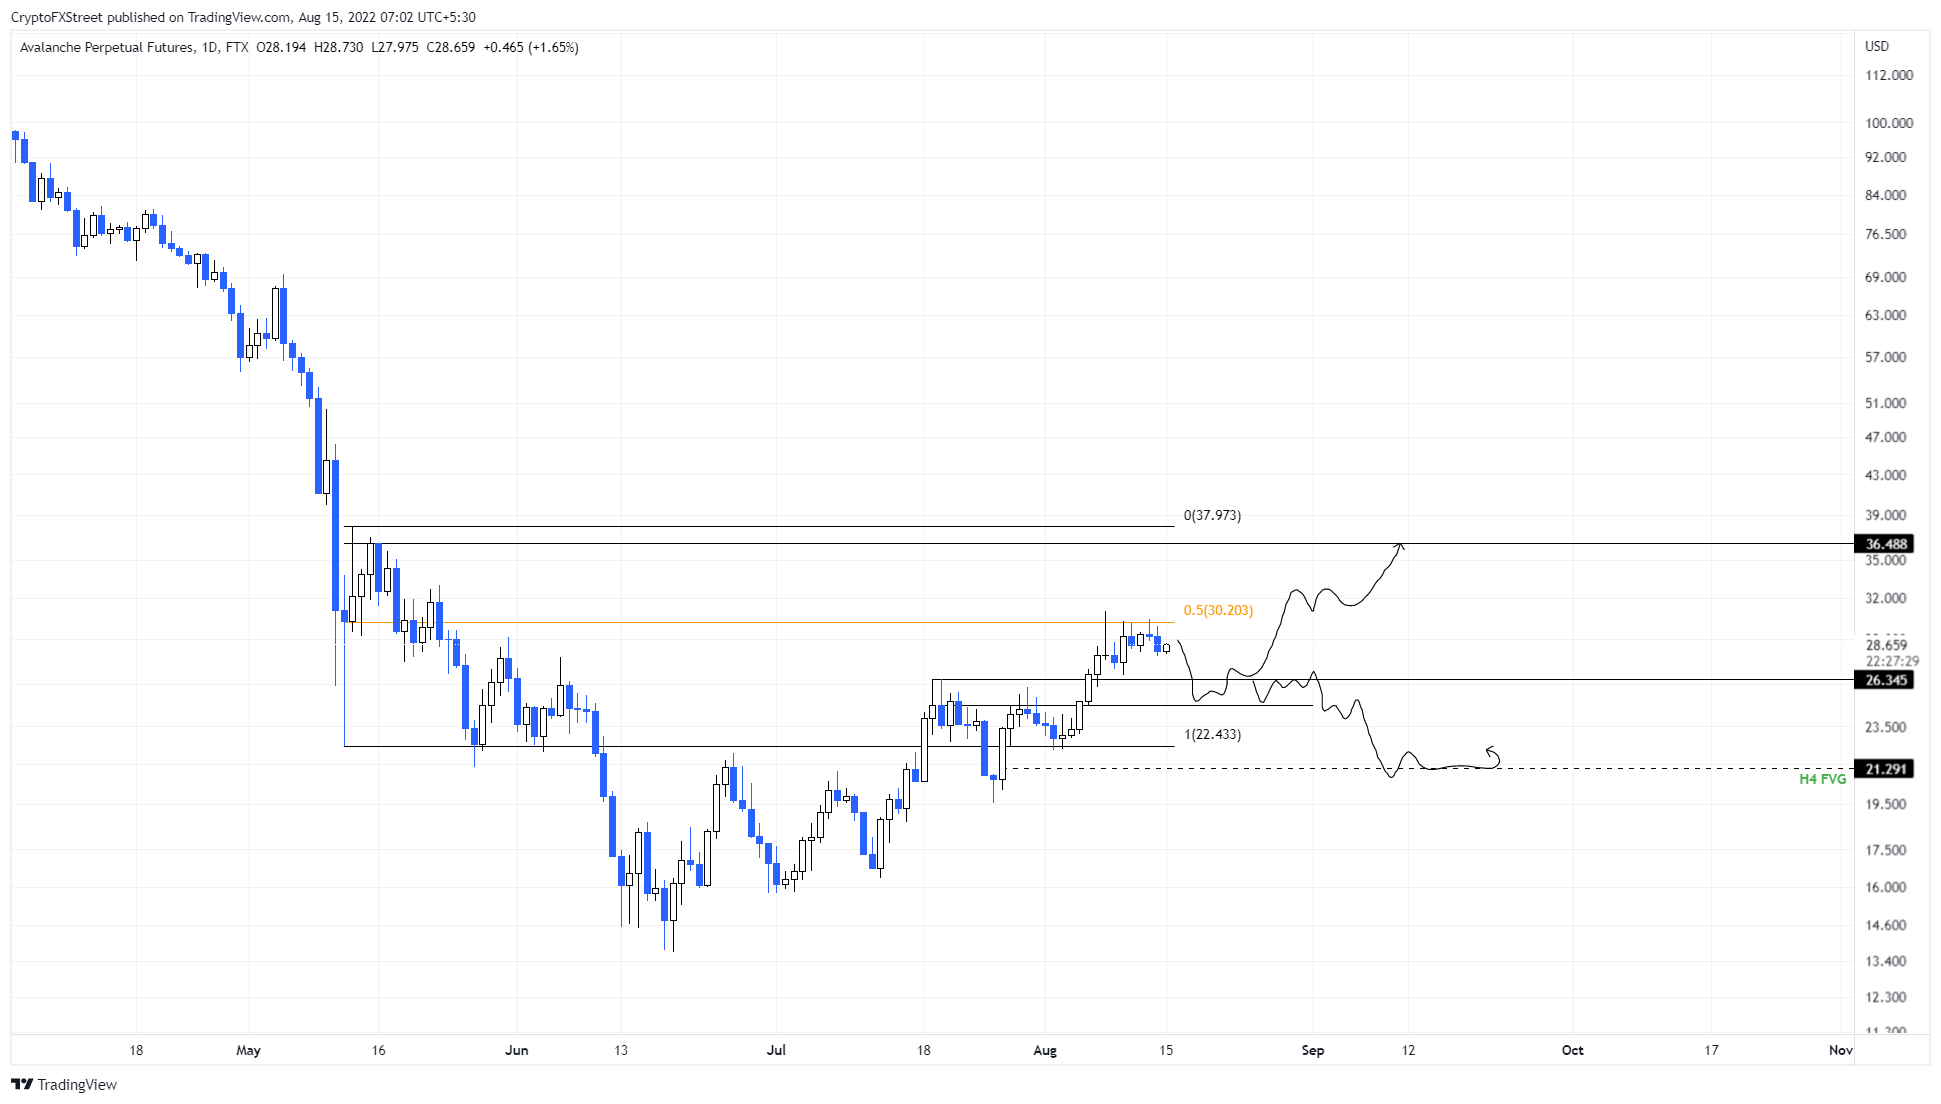
AVAX/USDT 1-day chart
If the $26.34 support level flips into a resistance barrier, investors can expect AVAX price to slide to the range low at $22.43, which is likely to provide a decent amount of support. However, bears might knock the altcoin lower to fill the fair value gap or the price inefficiency present at $21.29.
Hence, a failure to recover above $26.34 could result in a 19% downswing for AVAX price.
Author

Akash Girimath
FXStreet
Akash Girimath is a Mechanical Engineer interested in the chaos of the financial markets. Trying to make sense of this convoluted yet fascinating space, he switched his engineering job to become a crypto reporter and analyst.


