Avalanche’s AVAX price is finished unless this happens
- Avalanche’s AVAX price retraces into a key Fibonacci level.
- AVAX price faces resistance from both the 8- and 21-Day simple moving averages.
- Invalidation of the bearish trend is a breach above $27.

Avalanche’s AVAX price could endure another cataclysmic decline. Being an early buyer could be problematic.
Avalanche’s AVAX price needs more bullish evidence
Avalanche’s AVAX price is showing signs of optimism amidst the brutal decline investors have been experiencing. On July 4, 2022, the AVAX price successfully retraced into a key 61.8% Fibonacci level (surrounding June’s monthly low of $13.71 and a monthly high of $22.05) at $17.41. However, traders considering a long entry based on the recent bullish price action should beware that the 8- and 21-day simple moving averages (SMA) are also within the same vicinity of the current AVAX price at $17.49. The SMA’s are creating additional bearish resistance that bulls will need to hurdle; Furthermore, a bearish cross could result from the congestive collision of the SMAs and result in a 25% decline to $13.
AVAX price also confounds the idea of necessary caution on the Relative Strength Index. So far, there is no bullish divergence within the uptrend hike which deems the AVAX market behavior as corrective rather than impulsive. Thus, the downtrend remains entirely intact until further bullish evidence is provided. Additionally, a sell-off into the $10 price level could induce the RSI indicator to create the divergence or double-bottom signal that
.
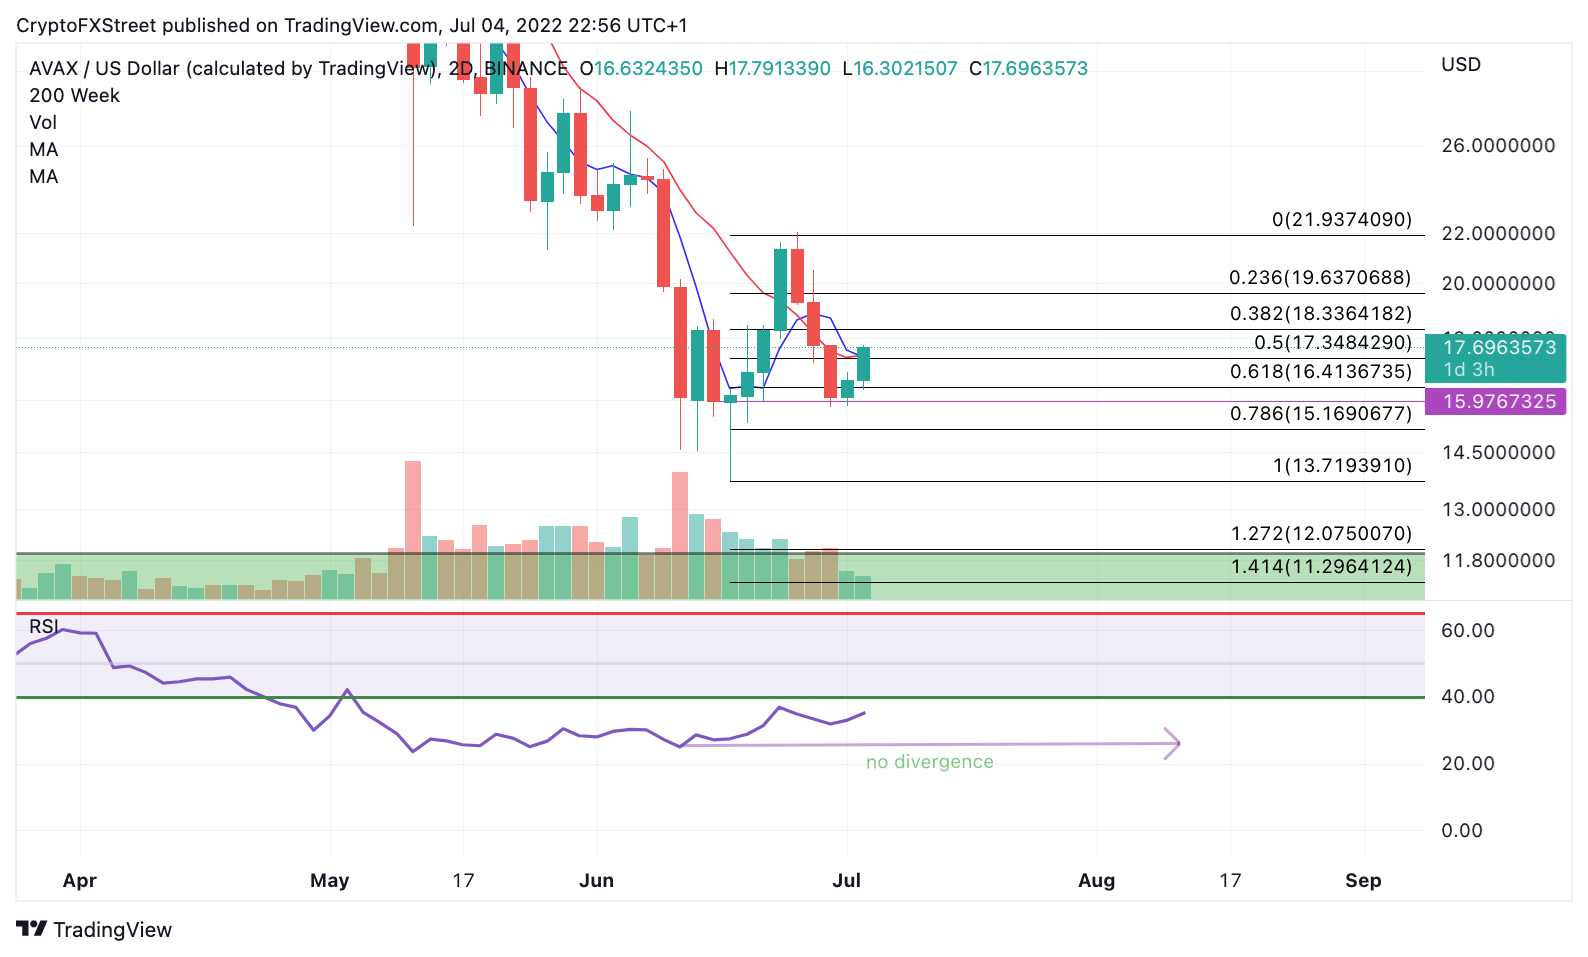
AVAX/USDT 2-Day Chart
The earliest Invalidation of the downtrend could be a breach above $27. If the bulls can hurdle this boundary, they may be able to rally as high as $50, resulting in a 190% increase from the current AVAX price.
Author

Tony M.
FXStreet Contributor
Tony Montpeirous began investing in cryptocurrencies in 2017. His trading style incorporates Elliot Wave, Auction Market Theory, Fibonacci and price action as the cornerstone of his technical analysis.


