As Ethereum grinds upwards past $200, these signals can fuel ETH price

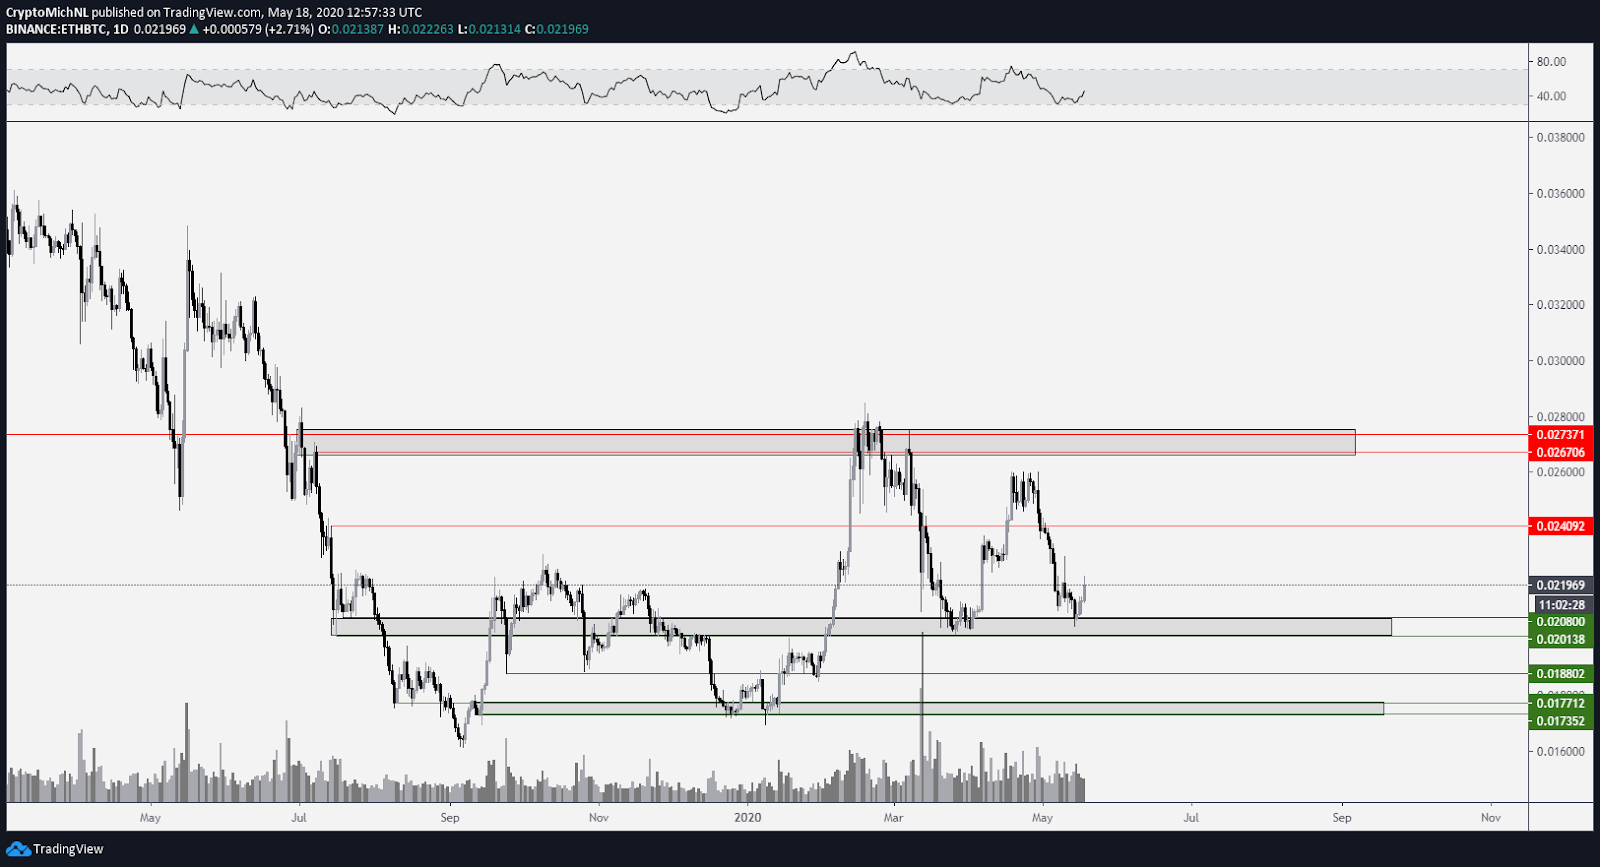
Ethereum is posting higher lows against its Bitcoin pair in recent weeks and this is a bullish sign for a possible breakout for ETH price.
While the focus has been on Bitcoin (BTC) price recently, it is slowly shifting towards different projects. There’s a straightforward reason for that: the halving has passed by, so the markets are reverting to their normal day-to-day fluctuations. Hence, altcoins can regain some more attention.
Based on that assumption, an analysis of Ethereum and its token Ether (ETH), the second-biggest cryptocurrency by market capitalization, is warranted.
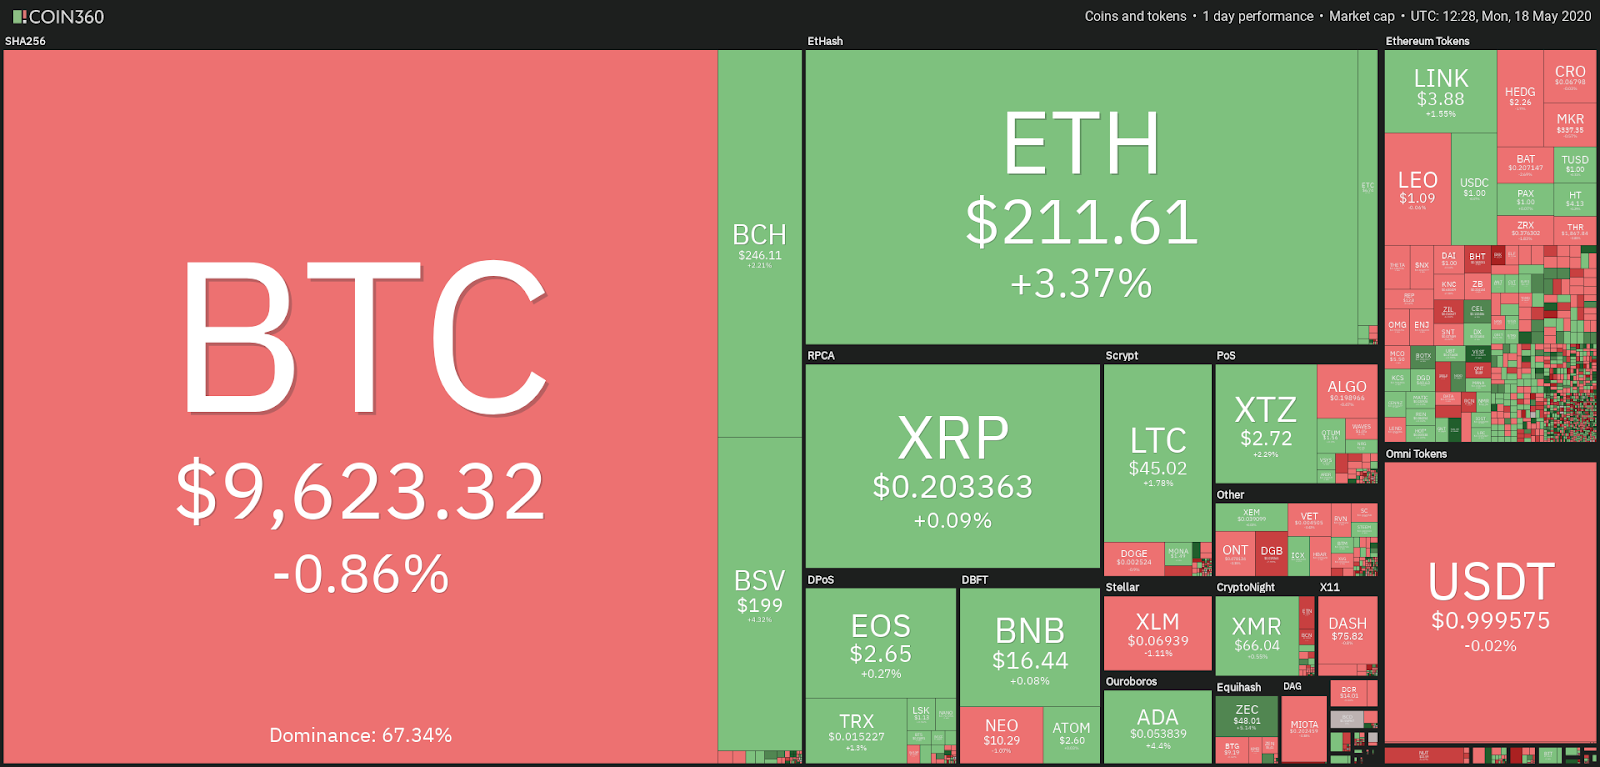
Crypto market daily performance. Source: Coin360
Ethereum facing heavy resistance between $215-230 as next hurdle
While Bitcoin has been acting inside a range of post-halving, the same can be stated about Ether. The price of ETH has found support in the $168-175 area, while the price is still unable to break through the upper barrier at $215-230.
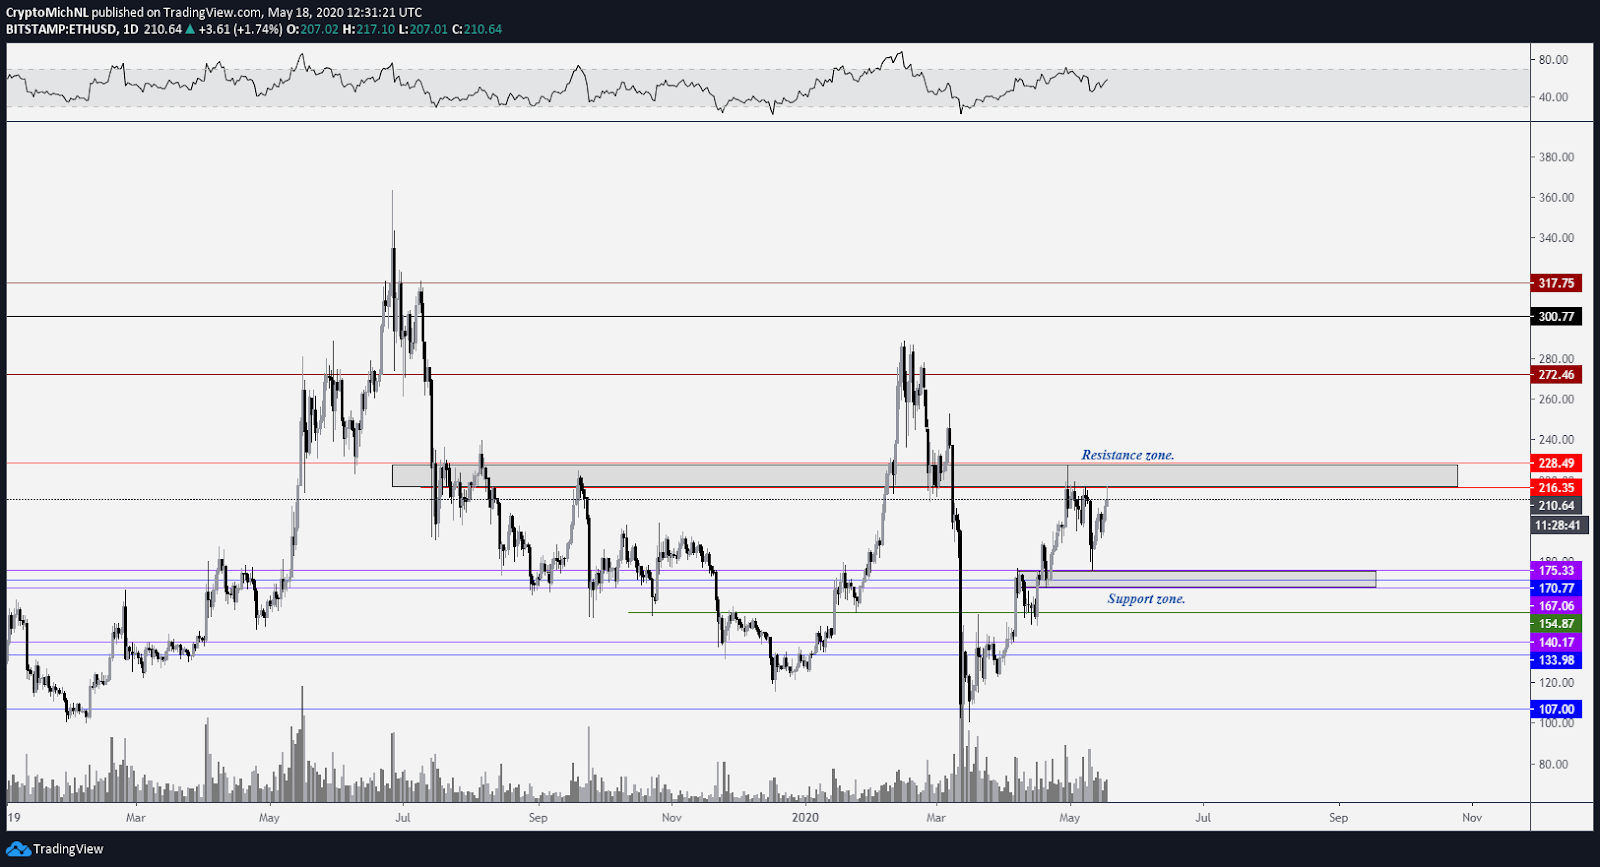
TH USD 1-day chart. Source: TradingView
More remarkably, the price of Ether is heavily lagging behind the price of Bitcoin. BTC has rallied back to the highs of February 2020, while Ethereum can’t provide the same strength and is still down 30% since.
What does that say? Well, the focus has been on Bitcoin due to the halving. A heavy selloff in altcoins occurred during the last push in BTC price (from $7,800 to $10,400) and the BTC altcoin pairs were crushed with drops of 20% and 30%.
However, history tells us that Bitcoin almost always runs first. The peak of Bitcoin was reached in December 2017 while the altcoins made their all-time highs in the first quarter of 2018.
Thus, Bitcoin has to stabilize and calm down, after which altcoins can have a chance to catch up. And based on that, they can get momentum to reclaim their February 2020 levels, which for Ether is $270-300.
Total market capitalization holding significant support
The total market capitalization of cryptocurrencies is showing some impressive and significant indications of potential upwards momentum.
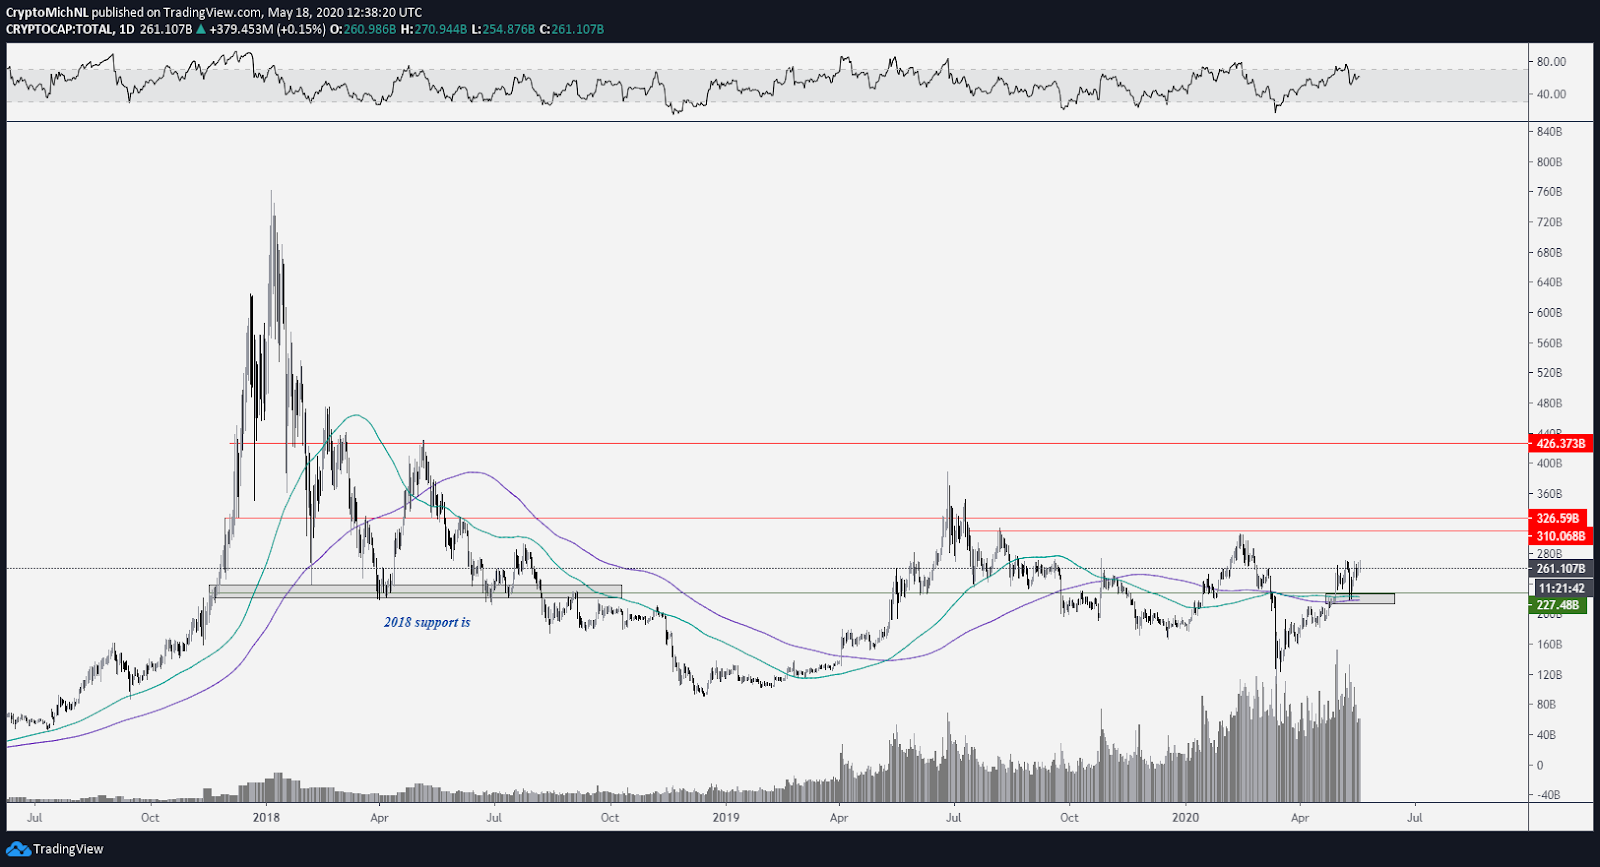
Total market capitalization cryptocurrency 1-day chart. Source: TradingView
First of all, the total market capitalization is finally flipping the 2018 level for support again. That support level can be classified as the support on Bitcoin at $6,000. The price of BTC saw many bounces at that level in 2018 before the big crash occurred.
Based on that, the total market capitalization is lagging significantly behind as the price of Bitcoin is currently at $9,600, which is 60% higher than this support. Conclusion: altcoins are lagging.
Second, the chart is showing an increase in volume. An increase in volume, while still moving sideways, indicates accumulation and increased interest in the asset. An increase in volume is a bullish signal.
Finally, the 100-day and 200-day moving averages (MA) on the daily timeframe are showing support, after which these MAs have confirmed support in the recent crash.
Why is this significant?
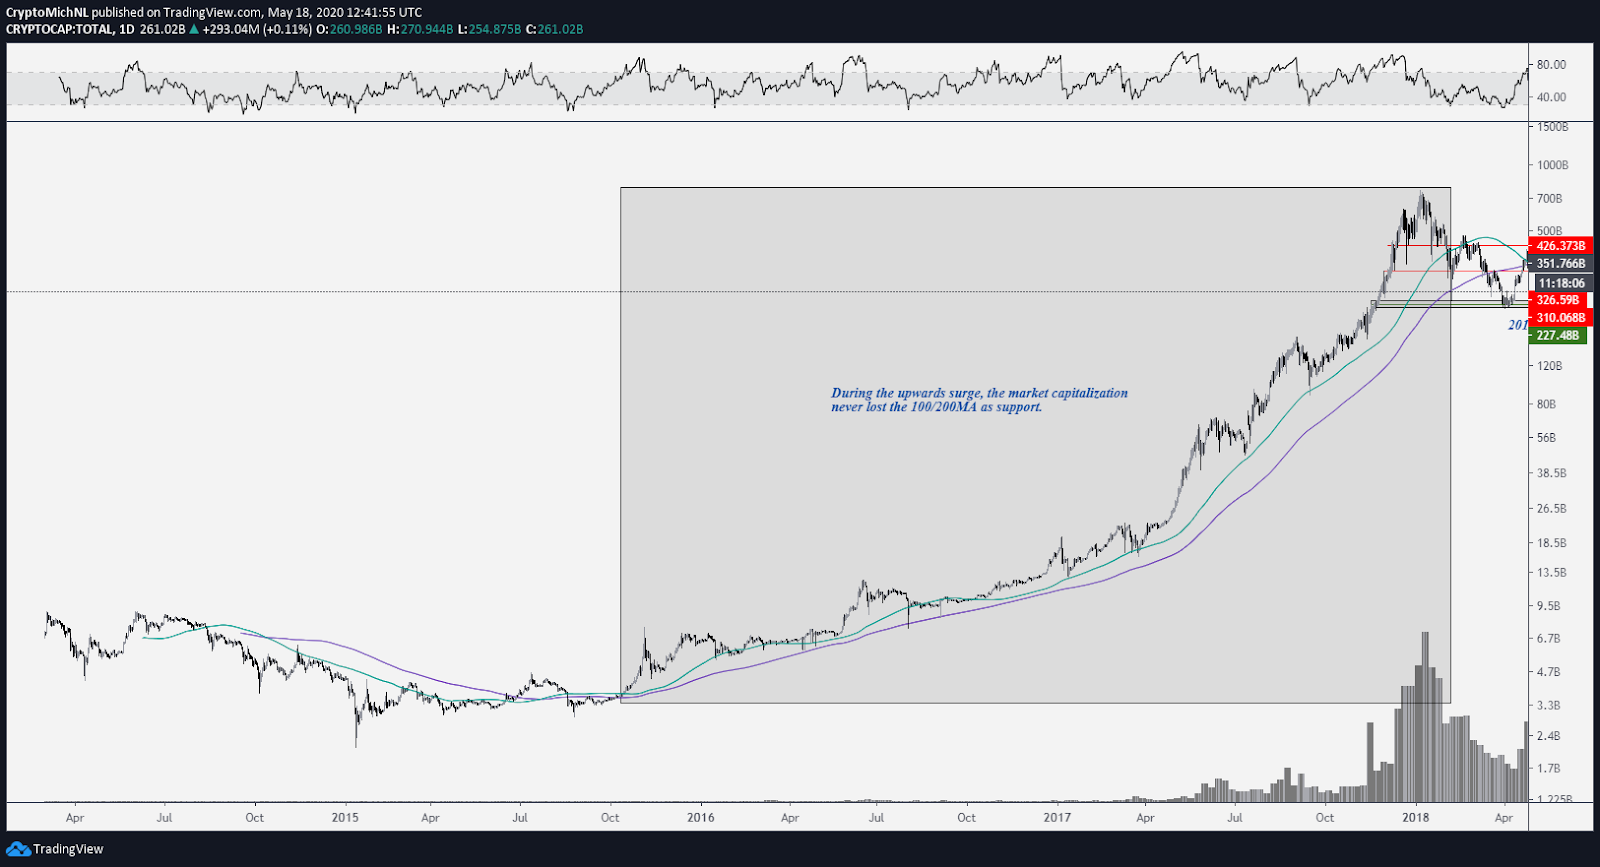
Total market capitalization cryptocurrency 1-day chart. Source: TradingView
The significance of the moving averages is shown in this chart. Throughout the previous bull cycle, the total market capitalization never lost the moving averages until it lost the 100-day MA at the beginning of 2018.
Holding and flipping these moving averages as support indicates strength and a potential trend shift. If the market capitalization loses these MAs, the market is back in bear territory.
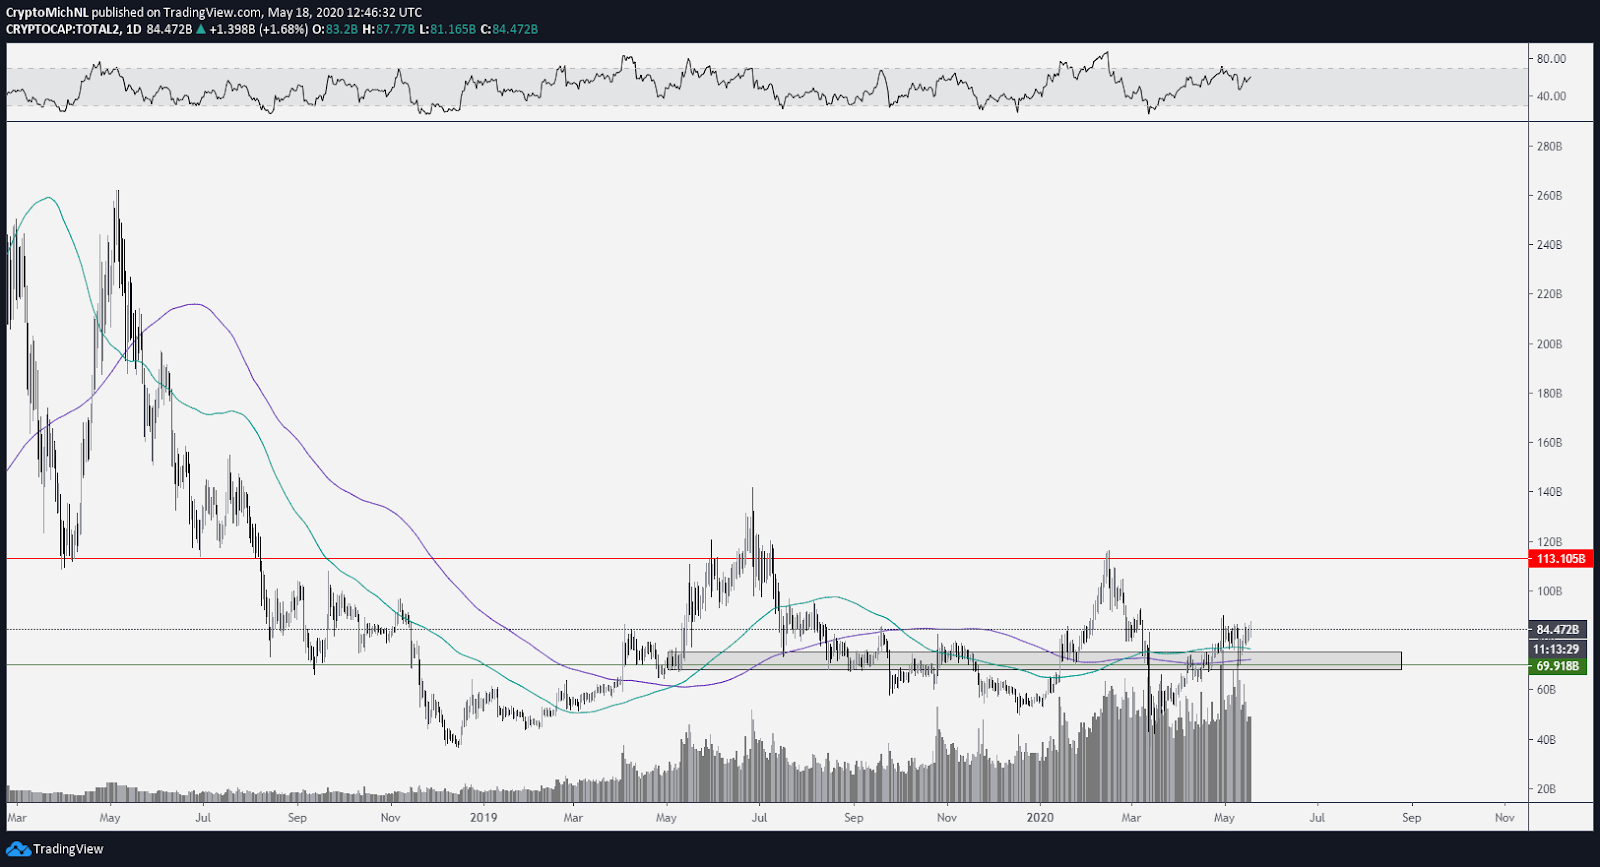
Total altcoin market capitalization cryptocurrency 1-day chart. Source: TradingView
The total altcoin market capitalization shows a similar structure to the total market capitalization. Even more remarkably, the support of Bitcoin at $6,000 can be compared with the red, horizontal line in this chart.
Through that, the conclusion is made that altcoins have been lagging heavily behind Bitcoin.
However, the altcoin market capitalization is also showing support on the 100-day and 200-day MA, while the $70 billion acts as support as well.
As long as these remain support, further momentum is expected towards $110-120 billion.
What are the levels to watch for Ethereum?
ETH USDT 1-day chart. Source: TradingView
Just as the total market capitalization of crypto is showing support at the 100-day and 200-Day MA, the same can be stated for Ether price.
As long as these MAs remain support, continuation is likely to be expected, and there are few reasons to become bearish except for sentiment based on historical experience.
The crucial level for ETH/USD to hold is the $168-173 area (a potential spike towards $160 could occur). If Ether holds that level, further continuation is warranted. A potential short-term correction towards this level is not unhealthy. Such a correction would confirm consolidation and confirmation of the $168-173 as support.
However, a flip of the $195 level can also be classified as a bullish support/resistance flip.
When either of these two levels becomes support, continuation is expected to occur for Ethereum.
What are the upwards targets for ETH price?
The first major target is found at $250-252. The second major target is $280-290 (the high in February 2020). After that, the $320-340 level is marked as the third level of significance.
However, the primary indicator would be whether Ethereum remains above the moving averages as these are substantial indicators for bull/bear momentum.
Author

Cointelegraph Team
Cointelegraph
We are privileged enough to work with the best and brightest in Bitcoin.


