- Uniswap unveils v3 of the protocol ahead of the mainnet launch in May.
- The upgrade gives liquidity providers more control and access to new flexible and efficient features.
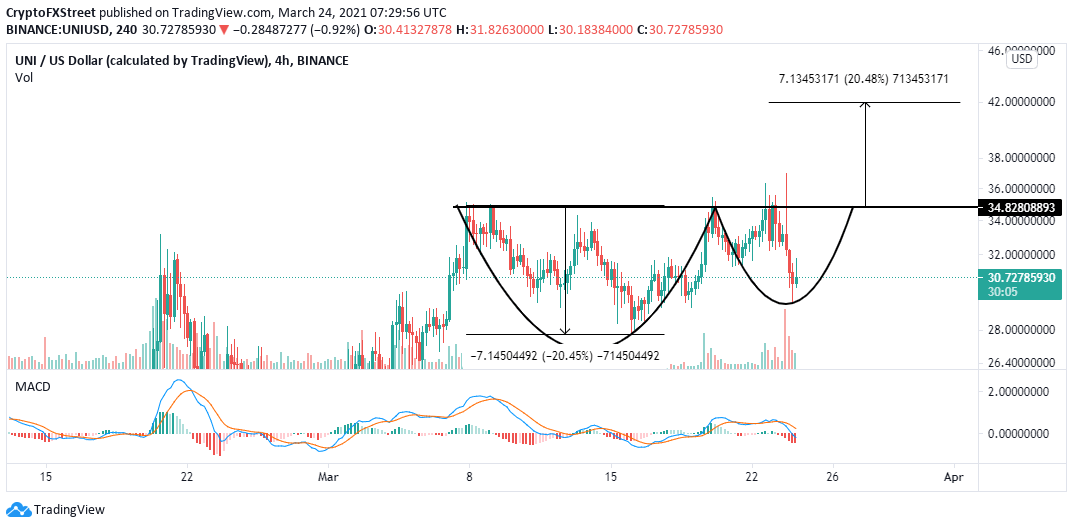
- Uniswap forms a cup and handle pattern, hinting at a 20% upswing to $42.
Uniswap is moving closer to the launch of version 3 (v3) of its protocol. The upgrade has been designed to make Uniswap one of the most flexible and capital-efficient protocols. At the time of writing, the Uniswap v3 is live and open to the public. However, the mainnet is expected to launch on May 5.
Uniswap v3 overview
According to details released by the Uniswap development team, the upgrade focuses on concentrated liquidity, allowing "individual liquidity providers (LPs) granular control over what price ranges their capital is allocated to." All the individual positions are then grouped into a single pool that creates a combined curve for all participants to trade against.
Simultaneously, the Uniswap v3 ensures that the LPs are compensated for the different degrees of risk they take. Some of the features that make Uniswap v3 the most flexible and efficient for automated market makers (AMMs) include 4,000x capital efficiency for LPs, low slippage trade execution, and allowing LPs to increase their exposure to their selected assets.
Uniswap v3 has made the process of integrating oracles cheaper and easier. Moreover, "the gas cost of v3 swaps on Ethereum mainnet is slightly cheaper than v2." The news regarding the launch has been received well by the community, with some members believing that it is the best-decentralized exchange (DEX) in the market.
Uniswap v3 is now public, after eighteen months of research and development: https://t.co/V0BRXgCtnI
— Dan Robinson (@danrobinson) March 23, 2021
I think it’s the best DEX design on the planet.
If you've heard me cryptically address a problem by saying that "Uniswap v3 fixes this," now I can finally explain why.
1/
Uniswap rebounds from the dip
Uniswap is exchanging hands at $30 following a bounce from the recently traded all-time high of $36. Support around $30 played a key role in stopping further losses—meanwhile, a cup and handle pattern on the 4-hour chart points toward a potential 20% breakout. A break above the resistance at $35 will confirm the impending upswing to $42.
UNI/USD 4-chart
The Moving Average Convergence Divergence (MACD) indicator shows that the uptrend is still in jeopardy and may get sabotaged or delayed in the short -term. This indicator tracks the asset's trend and measures its momentum. A signal to sell appears when the MACD line (blue) drops below the signal line. For now, Uniswap's least resistance path is downwards.
Information on these pages contains forward-looking statements that involve risks and uncertainties. Markets and instruments profiled on this page are for informational purposes only and should not in any way come across as a recommendation to buy or sell in these assets. You should do your own thorough research before making any investment decisions. FXStreet does not in any way guarantee that this information is free from mistakes, errors, or material misstatements. It also does not guarantee that this information is of a timely nature. Investing in Open Markets involves a great deal of risk, including the loss of all or a portion of your investment, as well as emotional distress. All risks, losses and costs associated with investing, including total loss of principal, are your responsibility. The views and opinions expressed in this article are those of the authors and do not necessarily reflect the official policy or position of FXStreet nor its advertisers. The author will not be held responsible for information that is found at the end of links posted on this page.
If not otherwise explicitly mentioned in the body of the article, at the time of writing, the author has no position in any stock mentioned in this article and no business relationship with any company mentioned. The author has not received compensation for writing this article, other than from FXStreet.
FXStreet and the author do not provide personalized recommendations. The author makes no representations as to the accuracy, completeness, or suitability of this information. FXStreet and the author will not be liable for any errors, omissions or any losses, injuries or damages arising from this information and its display or use. Errors and omissions excepted.
The author and FXStreet are not registered investment advisors and nothing in this article is intended to be investment advice.
Recommended Content
Editors’ Picks

Bitcoin Weekly Forecast: BTC nosedives below $95,000 as spot ETFs record highest daily outflow since launch
Bitcoin price continues to edge down, trading below $95,000 on Friday after declining more than 9% this week. Bitcoin US spot ETFs recorded the highest single-day outflow on Thursday since their launch in January.

Bitcoin crashes to $96,000, altcoins bleed: Top trades for sidelined buyers
Bitcoin (BTC) slipped under the $100,000 milestone and touched the $96,000 level briefly on Friday, a sharp decline that has also hit hard prices of other altcoins and particularly meme coins.

Solana Price Forecast: SOL’s technical outlook and on-chain metrics hint at a double-digit correction
Solana (SOL) price trades in red below $194 on Friday after declining more than 13% this week. The recent downturn has led to $38 million in total liquidations, with over $33 million coming from long positions.

SEC approves Hashdex and Franklin Templeton's combined Bitcoin and Ethereum crypto index ETFs
The SEC approved Hashdex's proposal for a crypto index ETF. The ETF currently features Bitcoin and Ethereum, with possible additions in the future. The agency also approved Franklin Templeton's amendment to its Cboe BZX for a crypto index ETF.

Bitcoin: 2025 outlook brightens on expectations of US pro-crypto policy
Bitcoin (BTC) price has surged more than 140% in 2024, reaching the $100K milestone in early December. The rally was driven by the launch of Bitcoin Spot Exchange Traded Funds (ETFs) in January and the reduced supply following the fourth halving event in April.

Best Forex Brokers with Low Spreads
VERIFIED Low spreads are crucial for reducing trading costs. Explore top Forex brokers offering competitive spreads and high leverage. Compare options for EUR/USD, GBP/USD, USD/JPY, and Gold.