Are ETH or XRP good for hedging BTC?

As a crypto asset holder, I have been wondering for a while as to what the best way would be to manage a portfolio in such a volatile market. BTC has clearly earned a position as digital gold. It has worldwide recognition, huge daily trading volume, and so many supporting crypto exchanges. But is it reasonable to just hold it and wait until its time has come? How can I minimize risk and maximize profit? Unfortunately, none of us really know what the future may hold. Therefore, yearning for a better portfolio management approach is a natural consequence of being a crypto asset holder.
I would like to invite us to think together about the following scenario: Let's suppose I invest in both coins A and B. If the price movements of coin A and coin B shows an inverse relationship, then I can make a strategic move by switching coin B to A when the price of coin B drops, or vice versa. To check the feasibility of this plan, I explored the correlation among 3 well-known coins: BTC, ETH, and XRP. If there is no strong positive correlation among those coins, I can construct a diversified portfolio to minimize risk and maximize profit.
Data Preparation
For the analysis, I downloaded 1-hour OHCLV data of the appropriate coins for the year 2019 from Binance. "Close" data is used for the analysis. Note I normalized the prices on these 3 coins for the purpose of chart comparison as they have different data scales. I applied the min-max scaling technique for normalization. So all price values have the same range from 0 to 1.
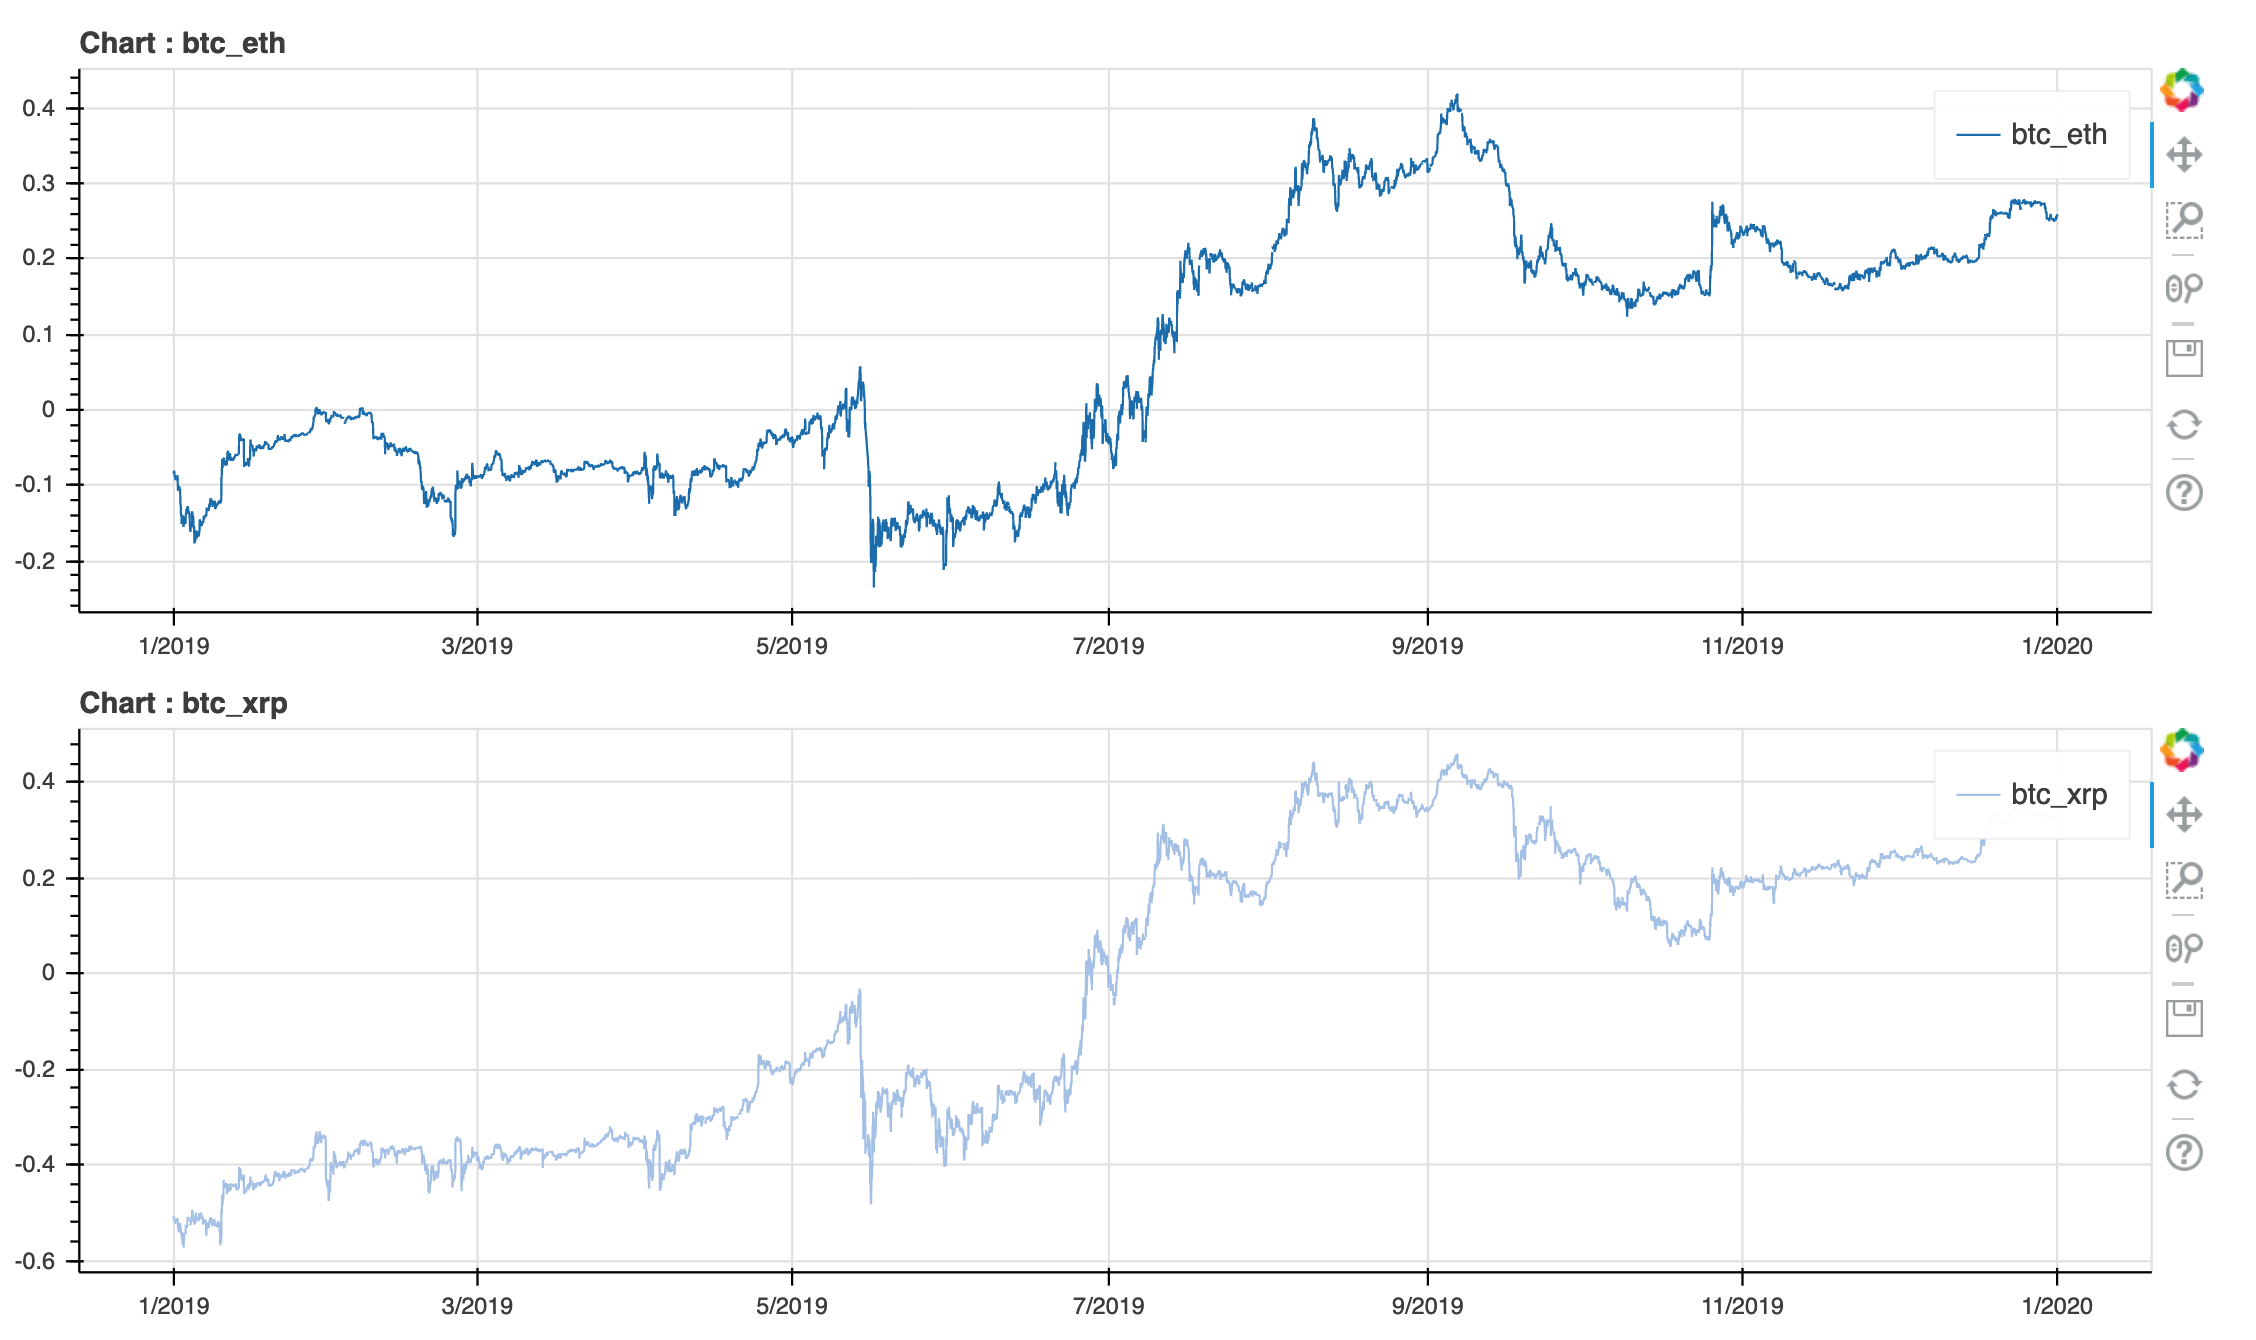
Close Price Chart
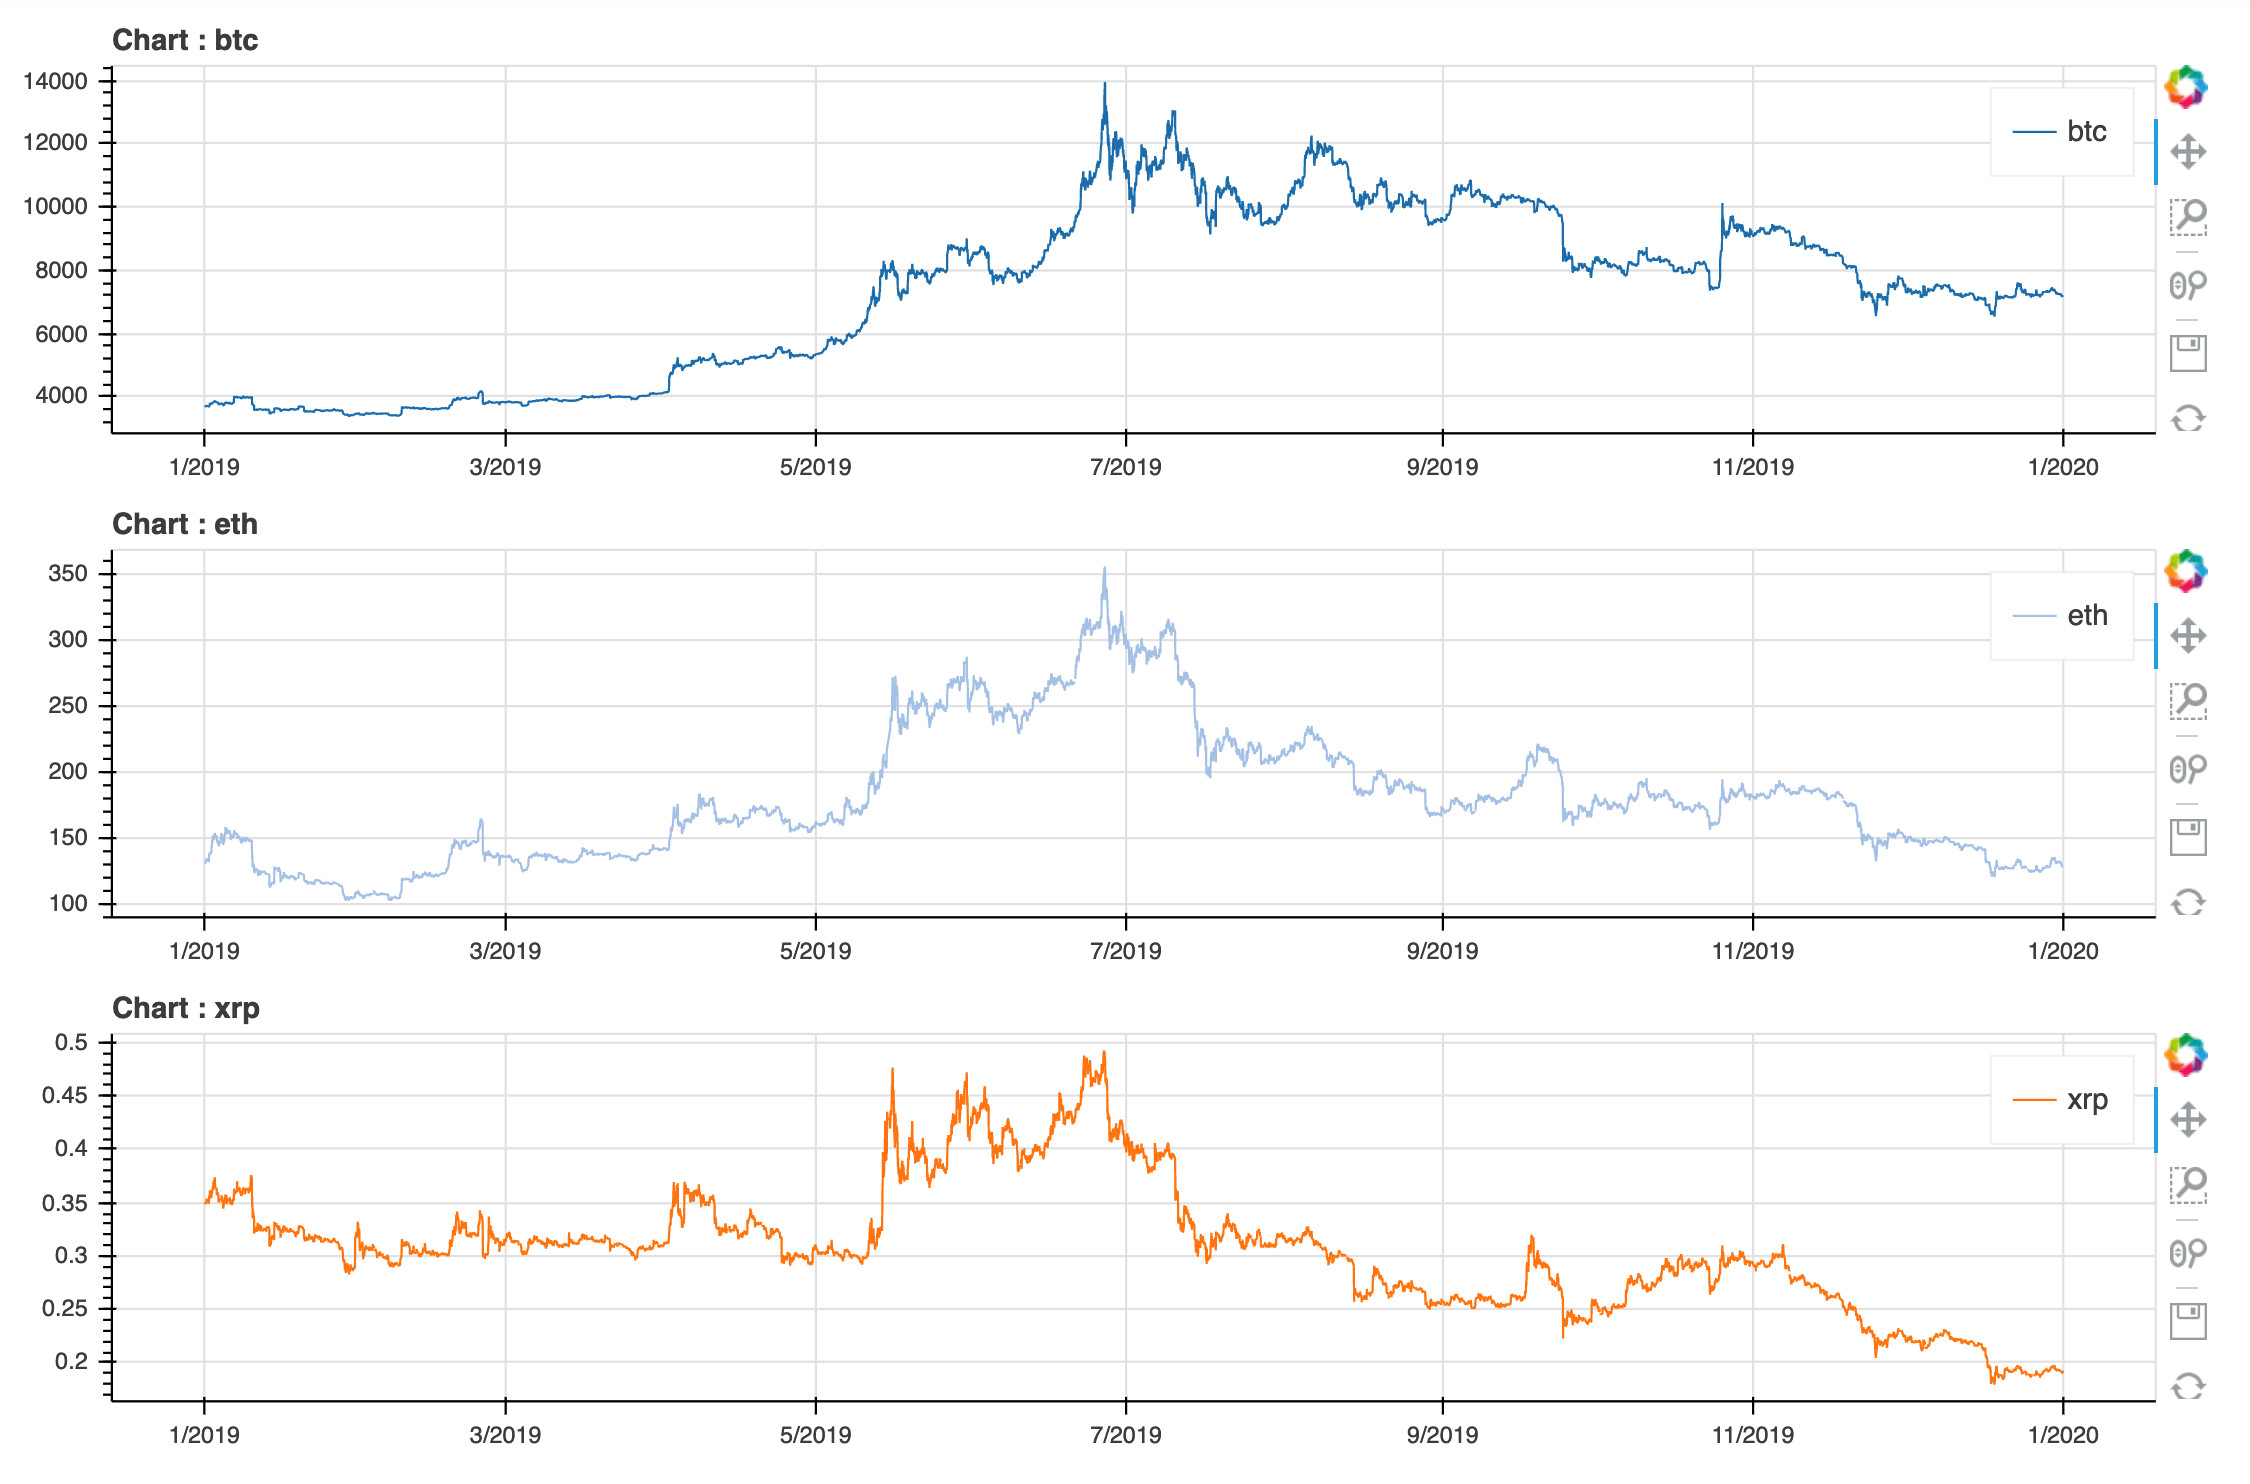
Let's take a look at the raw value of closing prices. As you can see, we can sense the trend of each coin's price but a comparison is difficult due to different scales.
Here is a scaled version of the price chart. Now we can compare each coin's price.
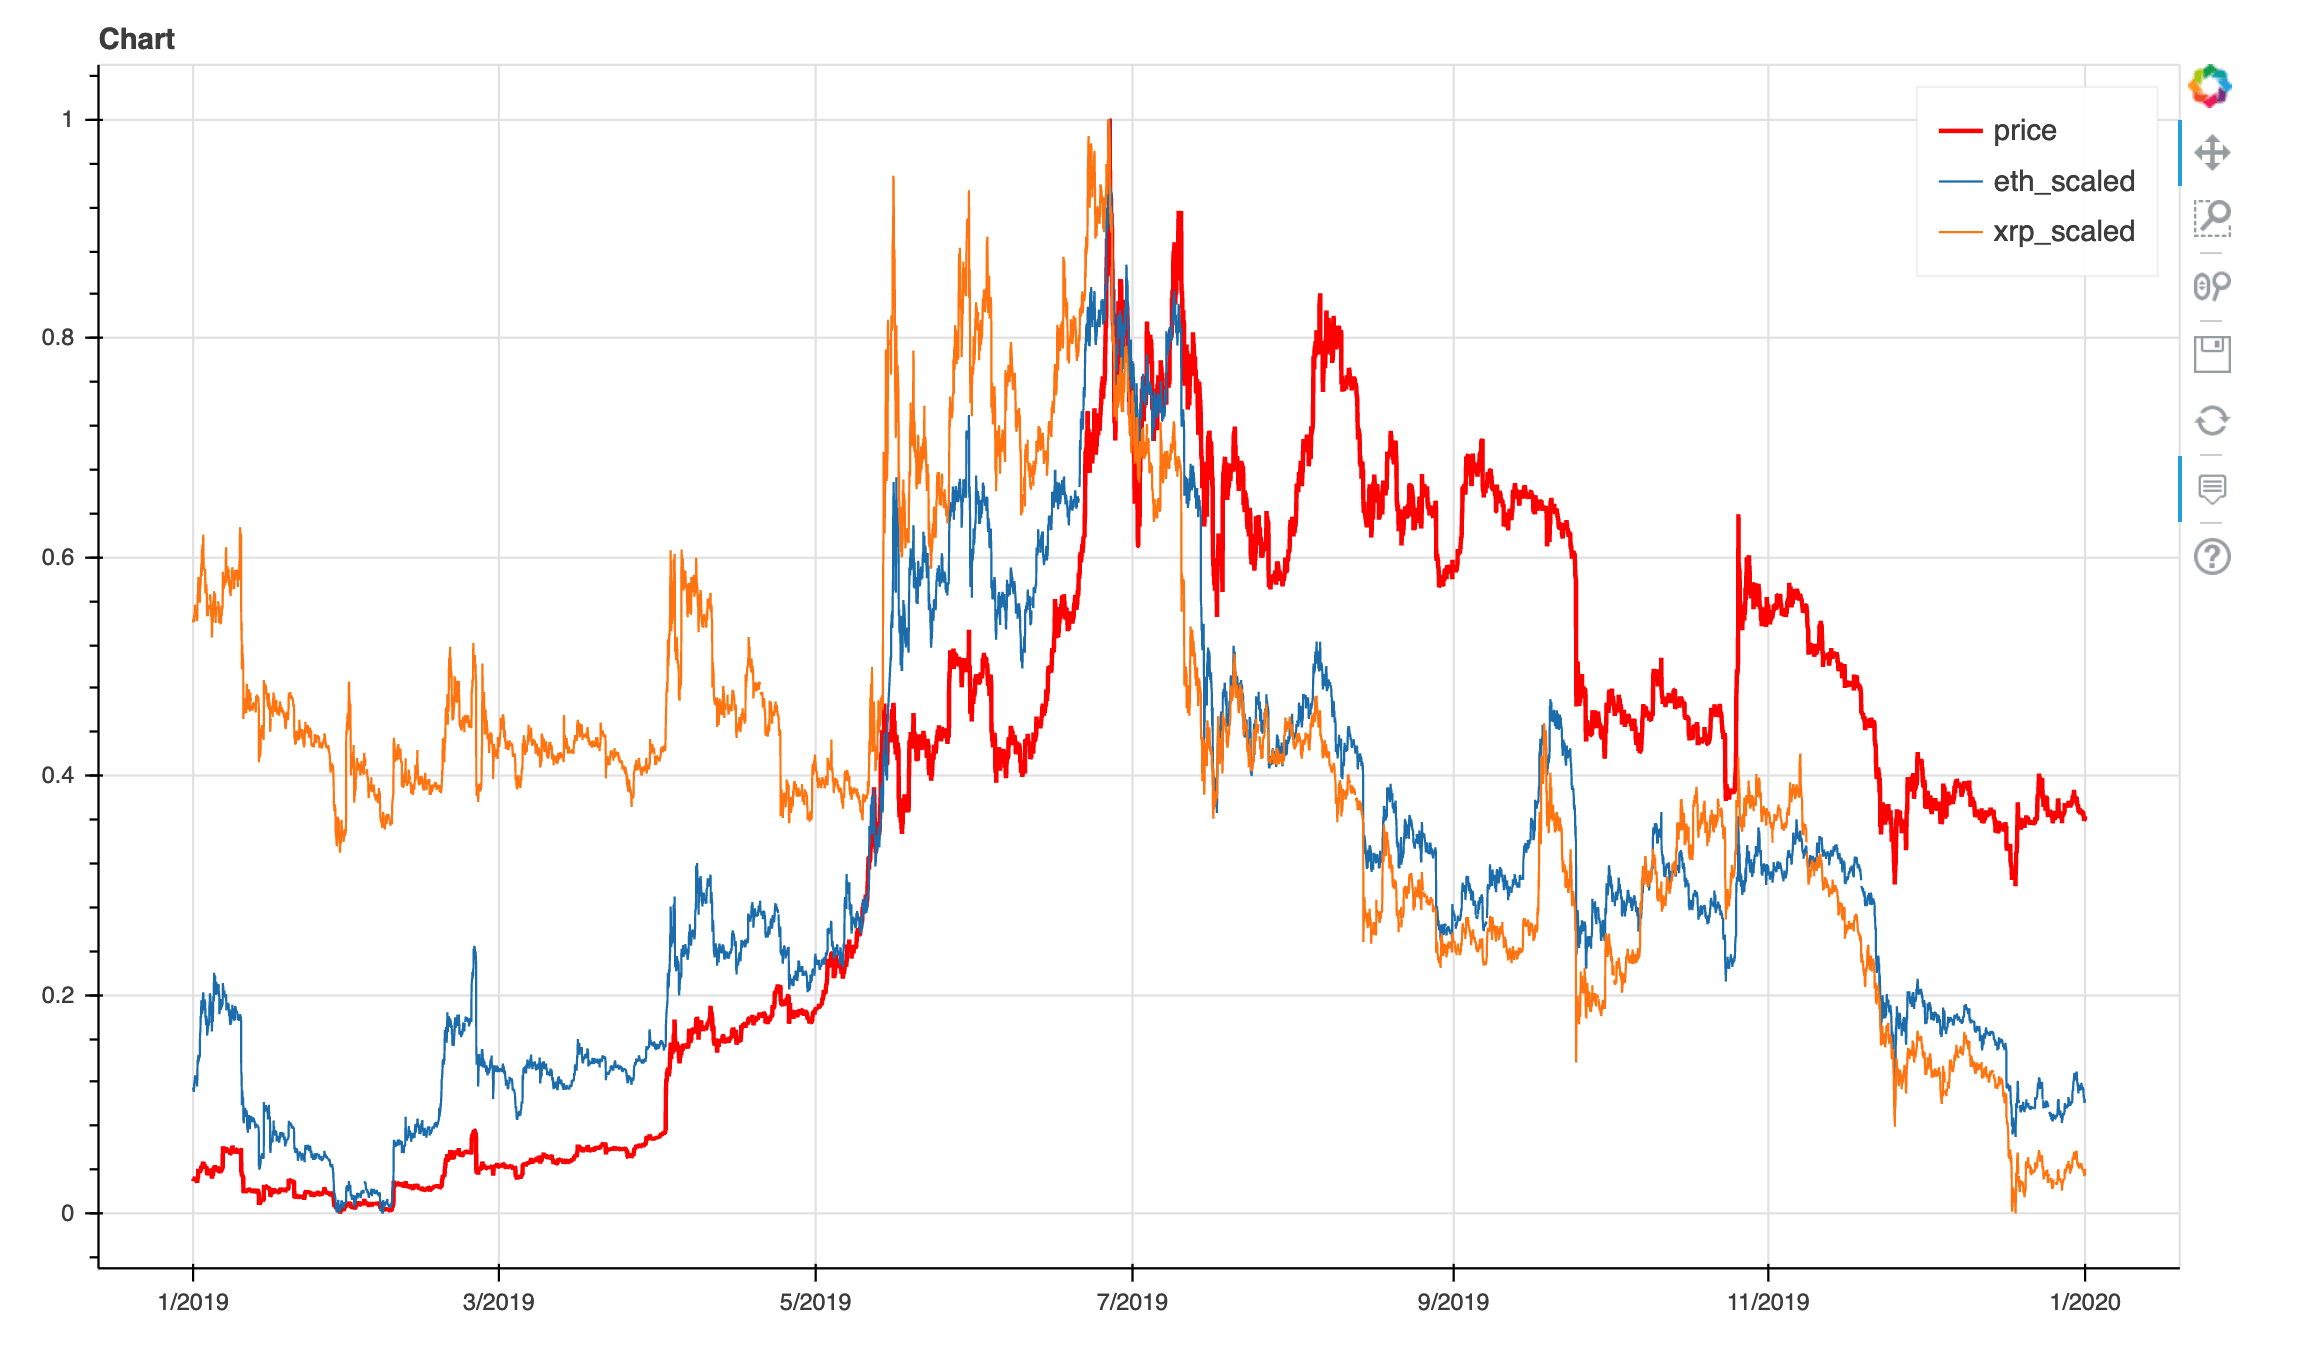
Note: The red line is the normalized BTC price.
At first glance it looks like a correlation is present but I need concrete proof.
Cross Correlation Coefficient
While there are several ways to conduct correlation analysis, I am going to use the Pearson correlation coefficient as it is a simple and well-known method. The coefficient tells whether two time series are correlated or not. The value ranges from 1 to 1. A value close to 1 means that two data sets have a positive relationship, whereas a value close to 1, implies a negative relationship.
Since the price data has a trend, first-order differences are used to calculate the coefficient.
The coefficient is shown below:
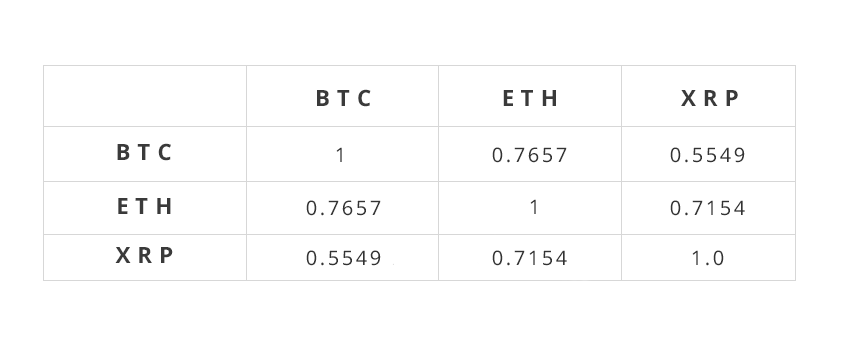
According to the coefficient, BTC and ETH have a strong positive relationship, 0.76. As a rule of thumb, we say that two variables have a strong positive relationship when their coefficient is 0.6 or greater. The strong positive relationship indicates that when the price of BTC goes up, so will the price of ETH with a great likelihood. The coefficient between BTC and XRP is 0.55-smaller than 0.76 yet still relatively high value. We can conclude that all three coins have a strong positive relationship one to another.
Rolling Correlation
The previous correlation was done for whole 2019 data. But if we can determine the correlations on shorter time scales and track that correlation it will offer more insight into the correlation.
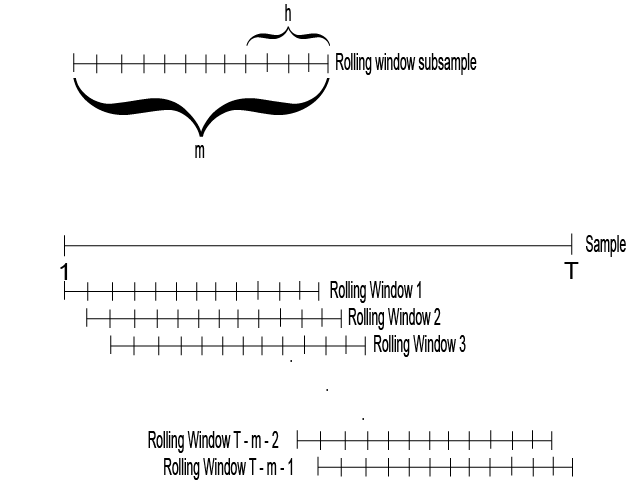
Let's compute the correlation again with a rolling window. A rolling window means that sub-datasets of the full data set are used.
The rolling window, therefore, consists of the selection of given window size (by analyzing the Root Mean Square Error).
For example, if the best window size is 24, we will be applying the model on the sample that is comprised of the first 24 observations; then on the second window, comprised of observations 225; then observations 326; and so forth.
The rolling window helps you to assess whether the parameters estimated by linear methods (intercept and slopes) are time-invariant (an important assumption of the model).
24 hours rolling correlation chart
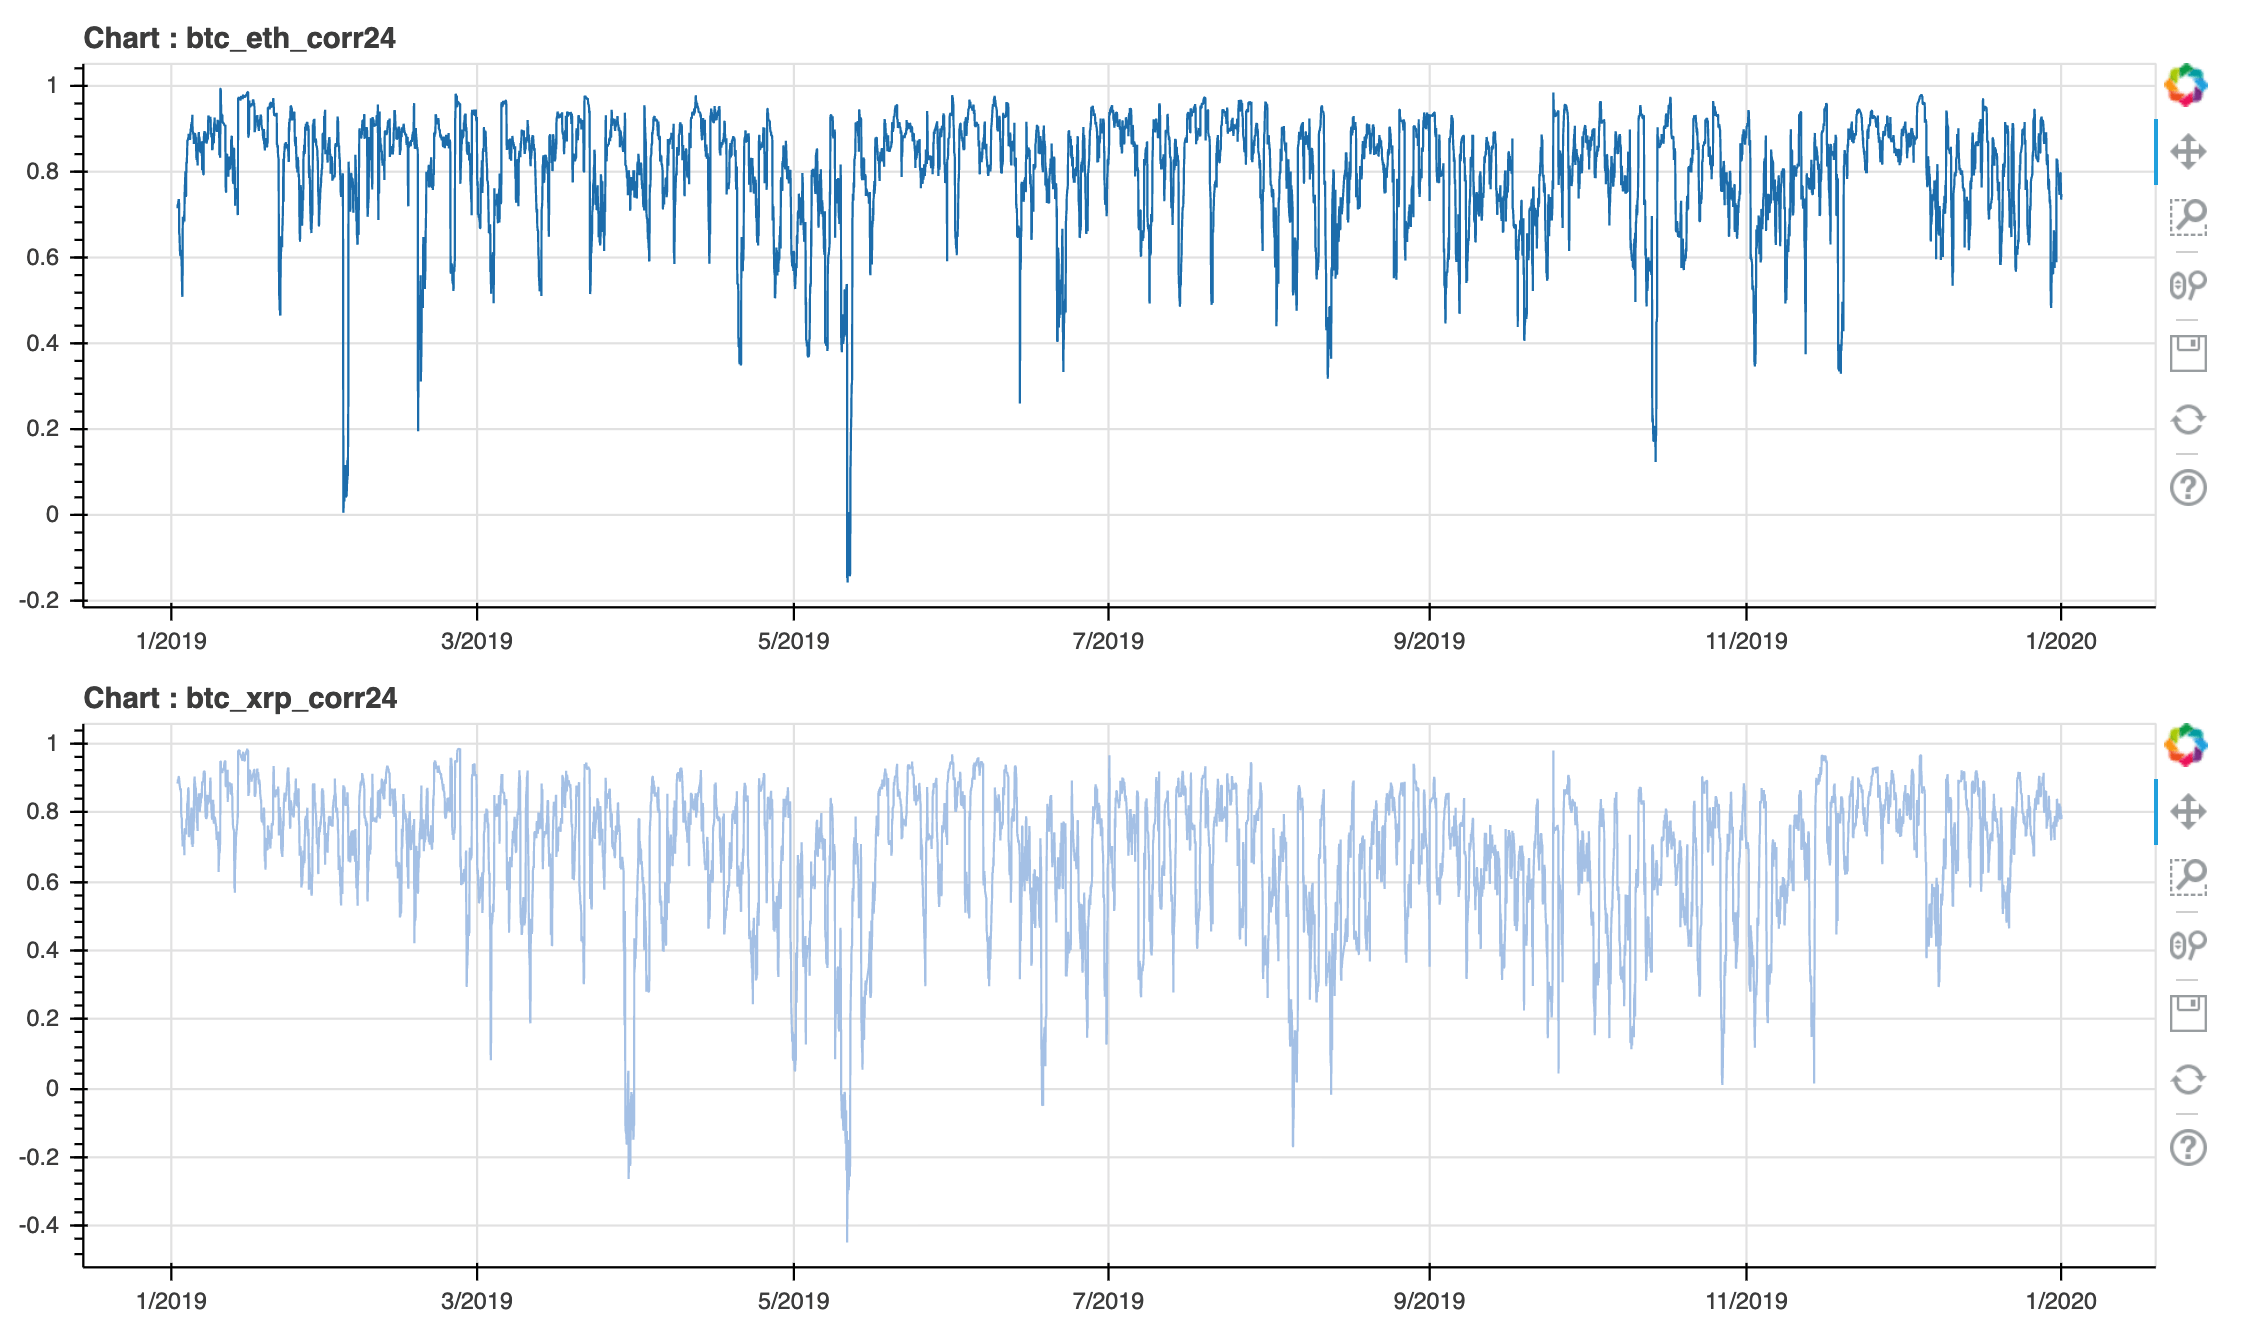
Let's dig further through histogram
The below chart is generated from the BTCETH Pearson coefficient through a 24 hours rolling window.
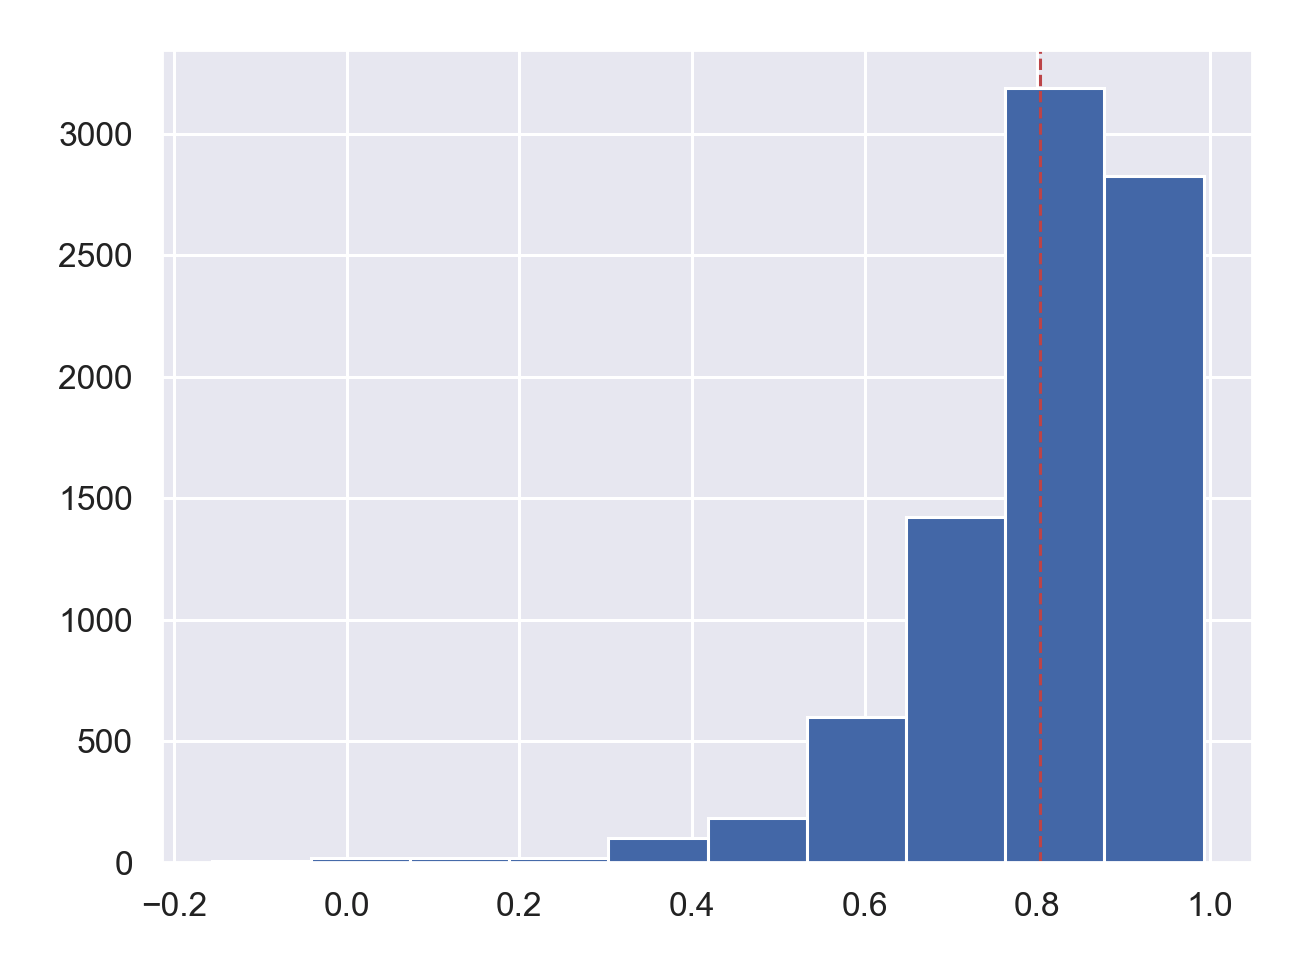
As you can see, the average Pearson coefficient is "0.82" which is a really strong positive relationship.
BTCXRP chart
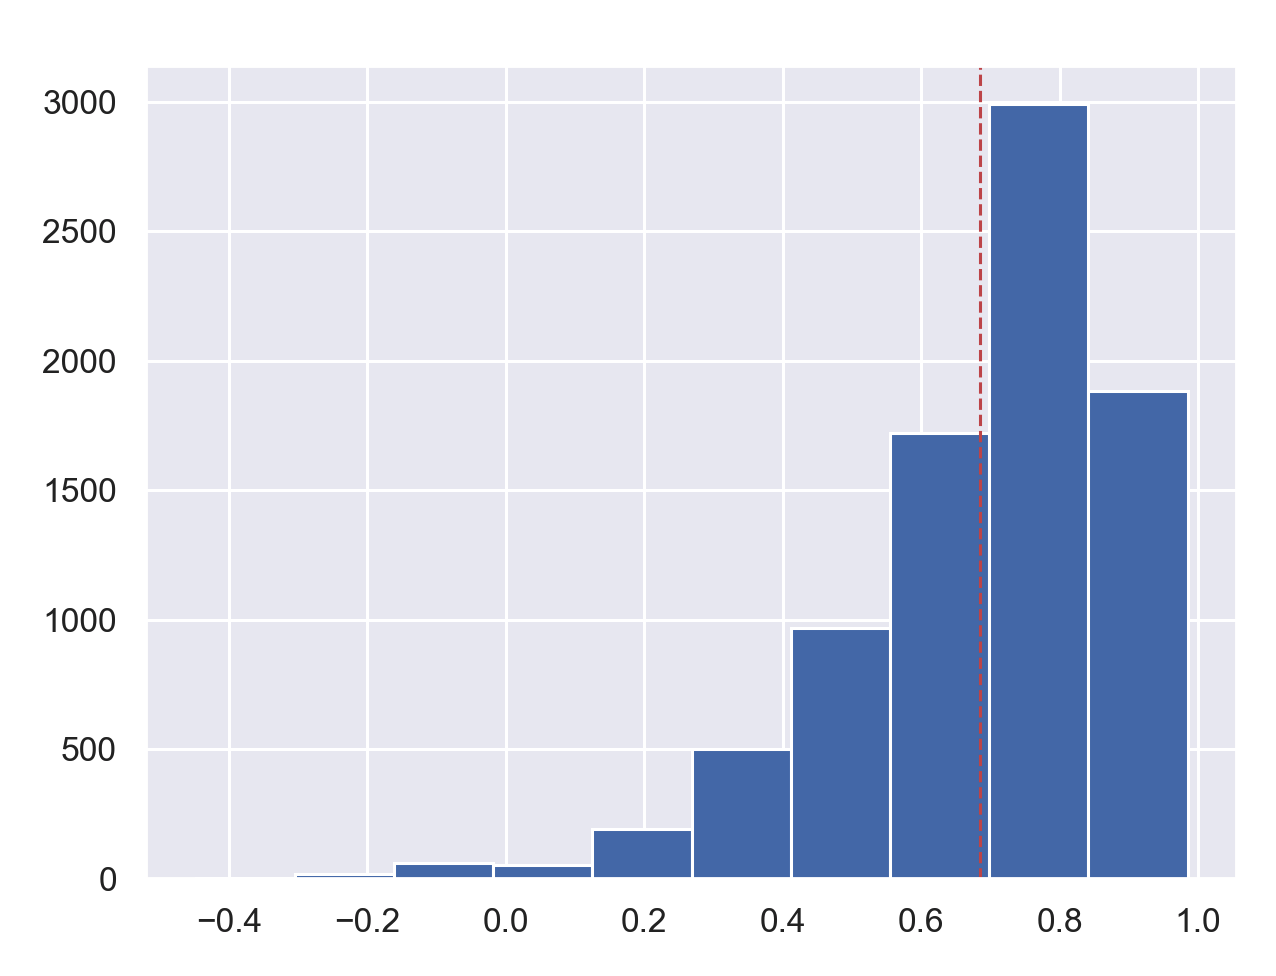
The average Pearson coefficient is "0.68". It is a high number. So we can say that BTC and XRP have a strong positive relationship. This is the same result compared to the previous one.
Here is a small conclusion. Both ETH and XRP have a strong positive relationship in a 24-hour rolling window. That means that if the BTC price goes up, ETH and XRP's price is likely to go up in a day. Before moving forward, let me make one thing very clear: correlation does not tell us about the order. In other words, it does not tell us which one would move first.
First-Order Differencing Data
Knowing correlation is good, but that's not enough. Think about when you are driving with your GPS. If your GPS tells you only the list of turns (left or right) without when to take those turns, it would be of no use. It is the same with the correlation data. To make the data practical and relevant for investment and portfolio management, we need to add the chronological dimension.
We can supplement that piece of information with differenced time-series data. Differenced time-series data could help us extrapolate chronological information from the data set by telling us the exact relationship between the time series data. In layman's terms, this can tell us more information on which one moves first. Let's look into the differenced time-series data of the three coins at hand BTC, ETH, and XRP. For this study, I created two sets of differenced data set: BTCETH and BTCXRP.
Those 2 datasets have correlation information from other perspectives.
Let's take a look at the chart below.
Differenced data set: BTC-ETH and BTC-XRP
We can interpret the value in following.
0 = no difference between 2 prices
0 or 0, the difference between 2 prices
Big value means that the difference is big.
The BTCETH differenced chart shows that from 201901 to 201905, BTC and ETH move similarly because the value is close to 0. But since 201907 it has changed.
Suppose the differenced data show a pattern, then we can derive a mathematical function from the pattern and utilize that as a tool to manage the portfolio. Let's check it.
Fitting Data
We can model a function to understand the relationship between two coins. If the model explains the movement of differenced data, we can use it to decide when to sell or buy, and what to sell or buy
Fitted model for BTC-ETH differenced chart
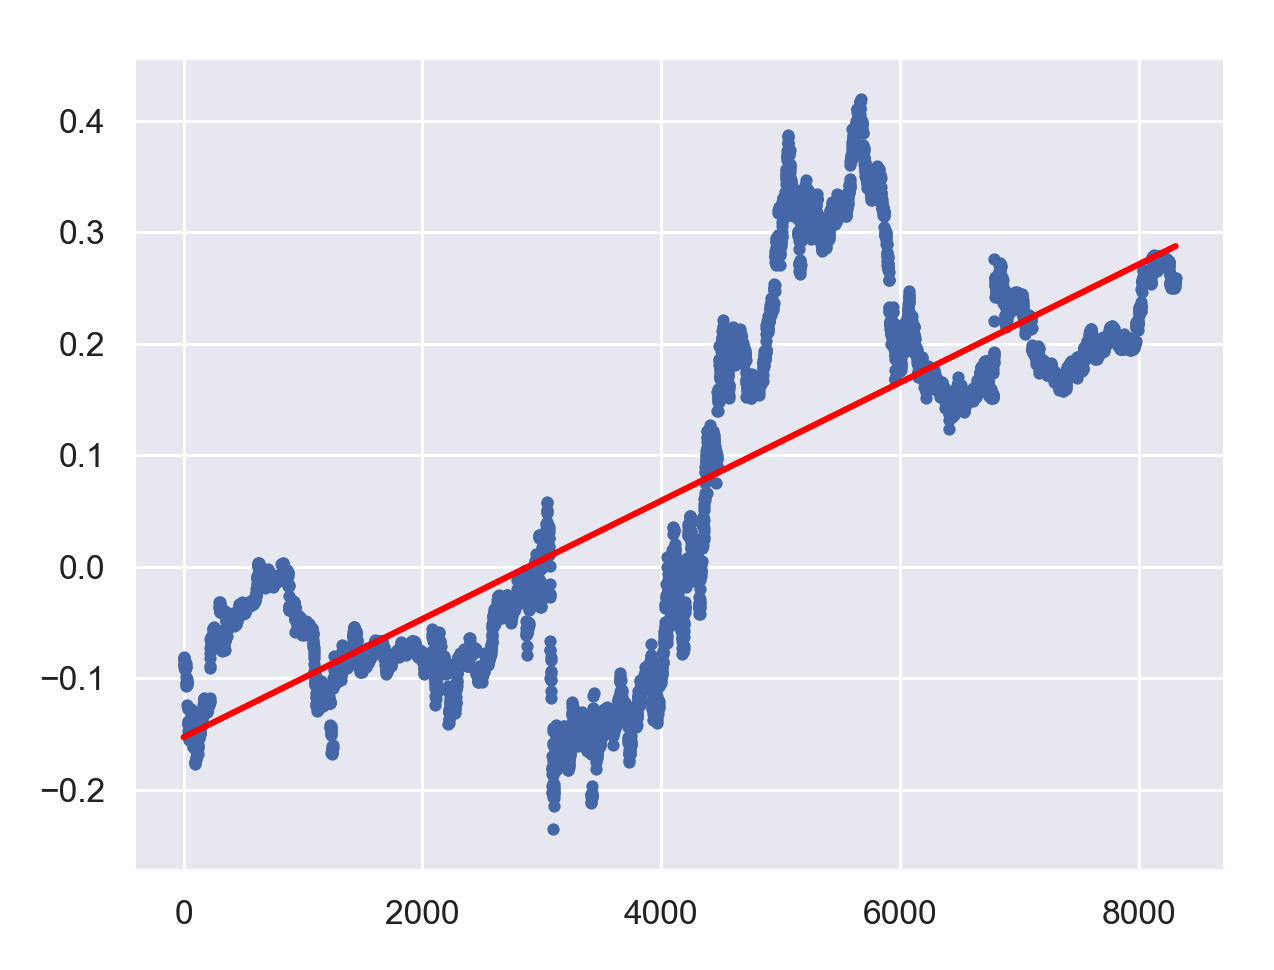
The red line is a fitted model function. It seems to be a good fit. To know how much the fitted function can explain the residual data set, I calculated the r2 score to be "0.61".
R-squared R2 ) score is a statistical measure that tells you how well the model fits the data. The score ranges from 0 to 1, and 1 means that the model explains all the variability of the data.
With an R2 score of 0.61, we can conclude that the model explains the BTCETH residual quite well.
Fitted model for BTC-XRP differenced chart
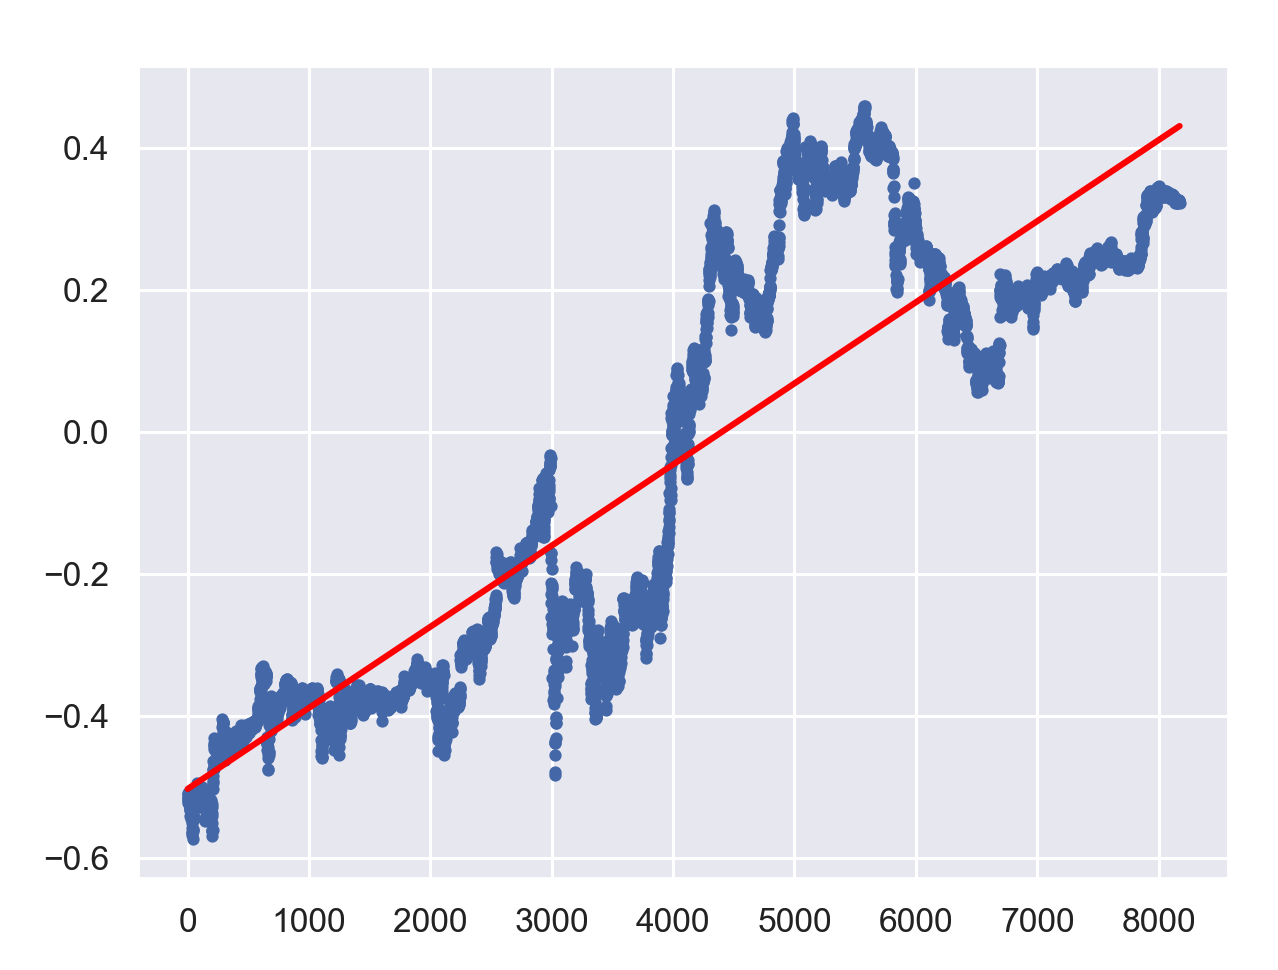
The BTCXRP has an even bigger r2 score of "0.78". So when I looked at the r2 score. The BTCXRP pair seems to be a better choice than the BTCETH pair because their fitted model is more reliable than that of BTCETH pair by having scored a higher r2 value.
Conclusion
The test result shows that ETH and XRP are correlated with BTC. The result implies that the three will likely show similar price movements. Therefore, we can conclude that it is not the best idea to hold both ETH and XRP as an attempt to offset the loss from BTC. We did not expect XRP to show a positive correlation with BTC as XRP had displayed a price movement different from that of BTC for a brief period in last year.
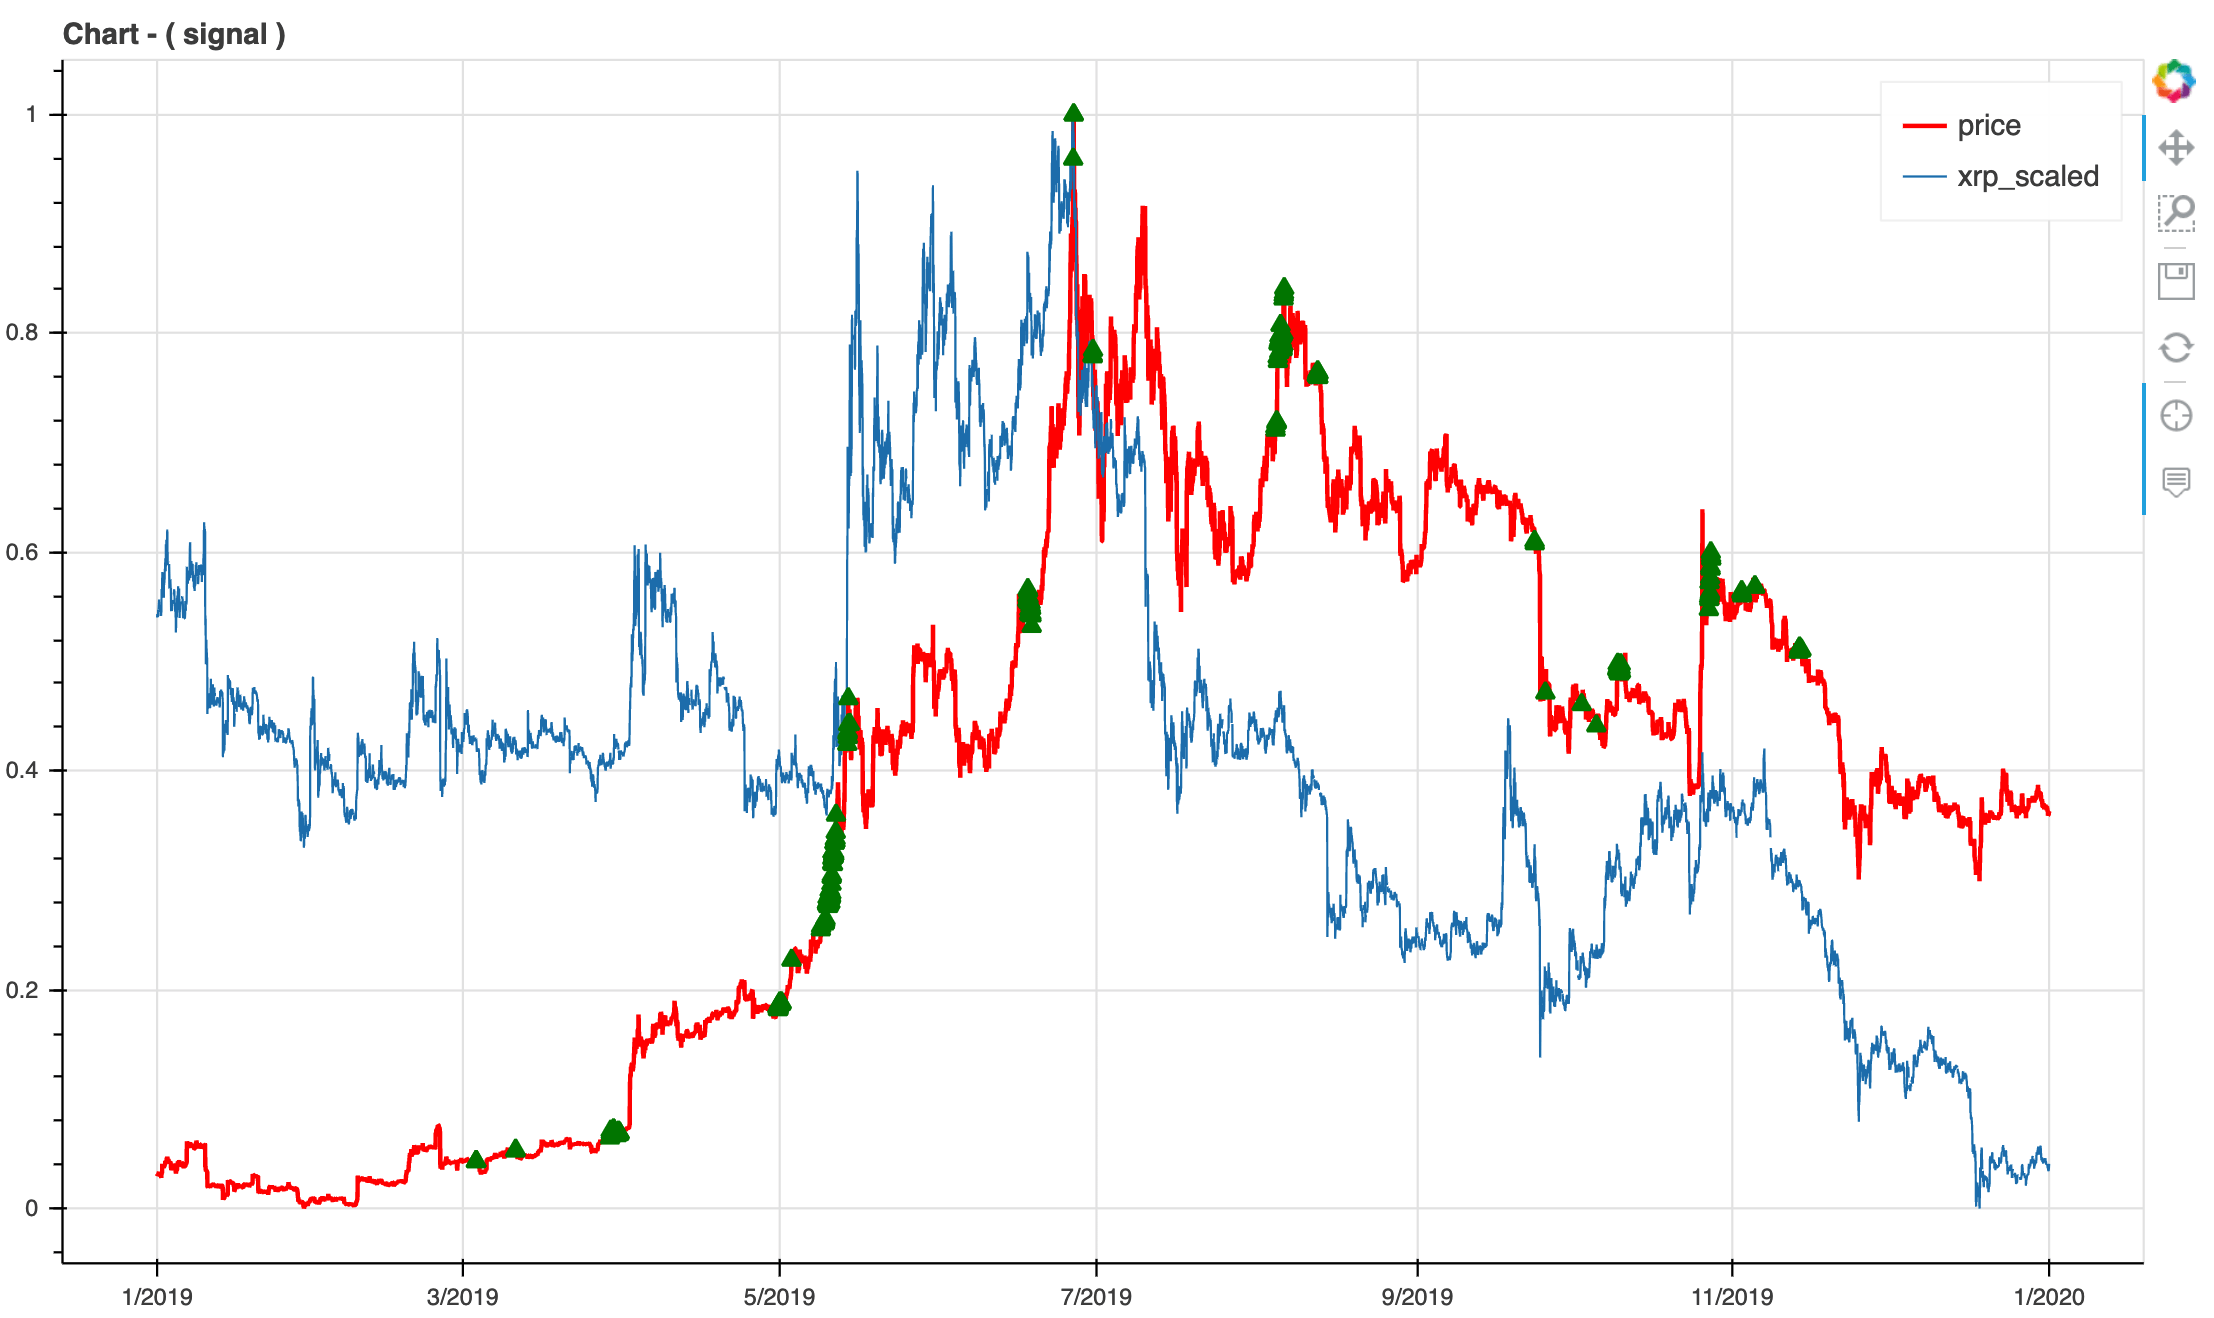
The following chart displays green triangles on points where BTC and XRP least correlate (coefficient<0.2. "201905" was the month with the least correlation with BTC. However, most of the time, it correlates with BTC.
The price movement of BTC and XRP in 2019
In portfolio management, diversification is heavily emphasized as a key principle to minimize risks. In this volatile and unpredictable market, minimizing potential risks is highly recommended. As the crypto market is highly correlated and dominated by BTC, a very careful design and study are required to construct a stable portfolio that can weather a high level of risk.
Author

James Ahn
MoA, powered by EdenChain Partners
James Ahn, Chief of Strategy at MoA and CEO at EdenChain Partners, has 20+ years of experience in the field of IT. He has worked as CTO at CyberRenassance Inc. (Japan) and later as a representative of MHR and DeepNumbers.


