Arbitrum price aims 30% rally after breakout from a double bottom pattern
- Arbitrum price has confirmed a breakout above the $0.9703 neckline of a double bottom pattern.
- ARB could rally 30%, steered by key on-chain metrics with a breakout objective of $1.2735, levels last tested in July.
- Invalidation of the bullish thesis will occur if the altcoin breaks and closes below the $0.9000 psychological level on the daily timeframe.
Arbitrum (ARB) price action beginning August through October has culminated in a double-bottom technical formation, coming at a time when the broader market is bullish, led by the king of cryptocurrency, Bitcoin (BTC).
Also Read: Arbitrum eyes decentralization with Orbit mainnet, ARB price fails to catch up
Arbitrum price action forms a double-bottom pattern
Arbitrum (ARB) price has recovered all the ground lost in October, and then some, with its price action from August 25 to October 31 building up to a double bottom pattern.
This technical formation occurs when the asset’s price reaches a low point (support), bounces back up to the neckline, dips again to the same support level, and then bounces back up again to the neckline. In so doing, it creates some sort of "W" shape.
Fundamentally, the market has twice failed to break through the support level, hinting a potential reversal to the upside. The first bottom of a double bottom pattern shows initial support while the second bottom indicates buying pressure. The breakout objective of target is measured by determining the distance between the support level and the neckline and superimposing it at the breakout point.
Arbitrum price eyes 30% rally to $1.2375
After a confirmed breakout from the neckline of the double bottom pattern at $0.9703, Arbitrum price climbed 8% to test the 50% Fibonacci retracement of the $1.3500 - $0.7380 downmove at $1.0440. However, it faced a rejection from this level, pulling back for a retest of the neckline, possibly because ARB was overbought.
Nevertheless, the upside potential remains plausible, with the Relative Strength Index (RSI) still above the 50 level and the Awesome Oscillator (AO) still in the positive zone with green prominent histogram bars.
Increased buyer momentum above current levels could send Arbitrum price north, clearing the 50% Fibonacci level at $1.0440 before an extension north. In a highly bullish case, the gains could extend for ARB market value to breach the $1.1000 and $1.2000 psychological levels before reaching the forecasted $1.2375 target, 30% above current levels. In highly ambitious cases, Arbitrum price could extend a neck high to tag the $1.3500 range high.
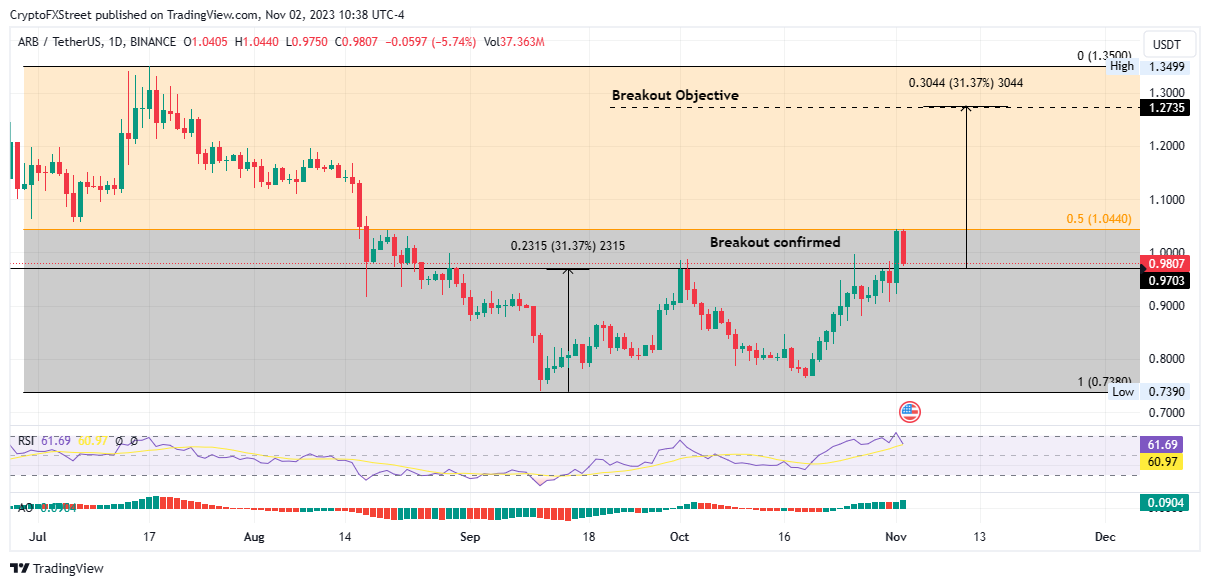
ARB/USDT 1-day chart
Arbitrum on-chain metrics support bullish outlook
Behavior analytics platform Santiment supports the bullish outlook for Arbitrum price, showing that the number of unique daily active addresses has increased significantly, pointing to crowd interaction or speculation for ARB token.
Also, the ARB network chart is also recording a notable climb, pointing to new addresses being created on the Arbitrum network daily, which translates to growing user adoption over time and, thus traction. The supply of Tether (USDT) stablecoin is also showing a significant ascent, indicating capital inflow as investors look to buy ARB.
More interestingly, the number of whale transactions moving more than 100,000 and more than one million USD worth of ARB is increasing. The surge signals significant engagement from major players and influential investors in the cryptocurrency world.
 [17.36.35, 02 Nov, 2023]-638345392062608569.png)
ARB Santiment
Conversely, increased seller momentum could send Arbitrum price below the neckline at $0.9703, or lower, to test the $0.9000 psychological level, which is also a critical support. A decisive daily candlestick close below this level would invalidate the bullish thesis.
In the dire case, the slump could send Arbitrum price to the $0.7380 support floor floor. Such a move would constitute a 30% fall below the current price.
Author

Lockridge Okoth
FXStreet
Lockridge is a believer in the transformative power of crypto and the blockchain industry.


