- ApeCoin surged more than 70% following its new cross-chain bridge launch on Sunday.
- This bridge allows users to transfer APE tokens between Ethereum and Arbitrum networks and earn a yield on their ApeCoin balances.
- ApeCoin’s technical outlook suggests the continuation of the rally.
ApeCoin (APE) consolidates its gains on Monday after surging over 70% on Sunday following its new cross-chain bridge announcement on ApeChain. This bridge enables users to transfer APE tokens between the Ethereum and Arbitrum networks. Additionally, the technical outlook indicates a potential continuation of this rally.
ApeCoin launches new cross-chain bridge
ApeCoin announced its new cross-chain bridge on ApeChain on Sunday. Due to this announcement on Twitter, its native token APE rallied more than 70% on that day as it served as the gas token for transactions on the new platform. This event has led to an increase in utility and demand for APE.
The lights are on. pic.twitter.com/0JV9ImmkDA
— ApeCoin (@apecoin) October 19, 2024
The Santiment’s Volume graph below shows a significant uptick in APE’s trading volume, with an increase of over 250% in just a short period.
%20[11.08.57,%2021%20Oct,%202024]-638650931184628500.png)
APE trading volume chart. Source: Santiment
ApeCoin introduced an update to its smart contract, adopting LayerZero’s Omnichain Fungible Token (OFT) standard. It is now an OFT that can seamlessly transfer between ApeChain, Ethereum, and Arbitrum. Additionally, ApeCoin’s native yield mechanism, developed with Decent, enables users to earn a yield on their ApeCoin balances without manual actions while maintaining omnichain interoperability.
ApeCoin technical outlook
ApeCoin’s weekly chart shows it has closed above the weekly resistance level of $1.11 after rallying nearly 100% last week and faces resistance around the 50% price retracement (drawn from the March 13 high of $2.683 to the August 5 low of $0.475) at $1.51. On Monday, APE’s price consolidates its recent gains around that level.
If APE closes above $1.51, it could extend the rally by 50% to retest its next weekly resistance at $2.29. A close above this level could extend the rally to retest its March 13 high of $2.68.
The Relative Strength Index (RSI) momentum indicator on the weekly chart trades at 63, above its neutral level of 50 and still far below overbought conditions, suggesting bullish momentum is gaining traction.
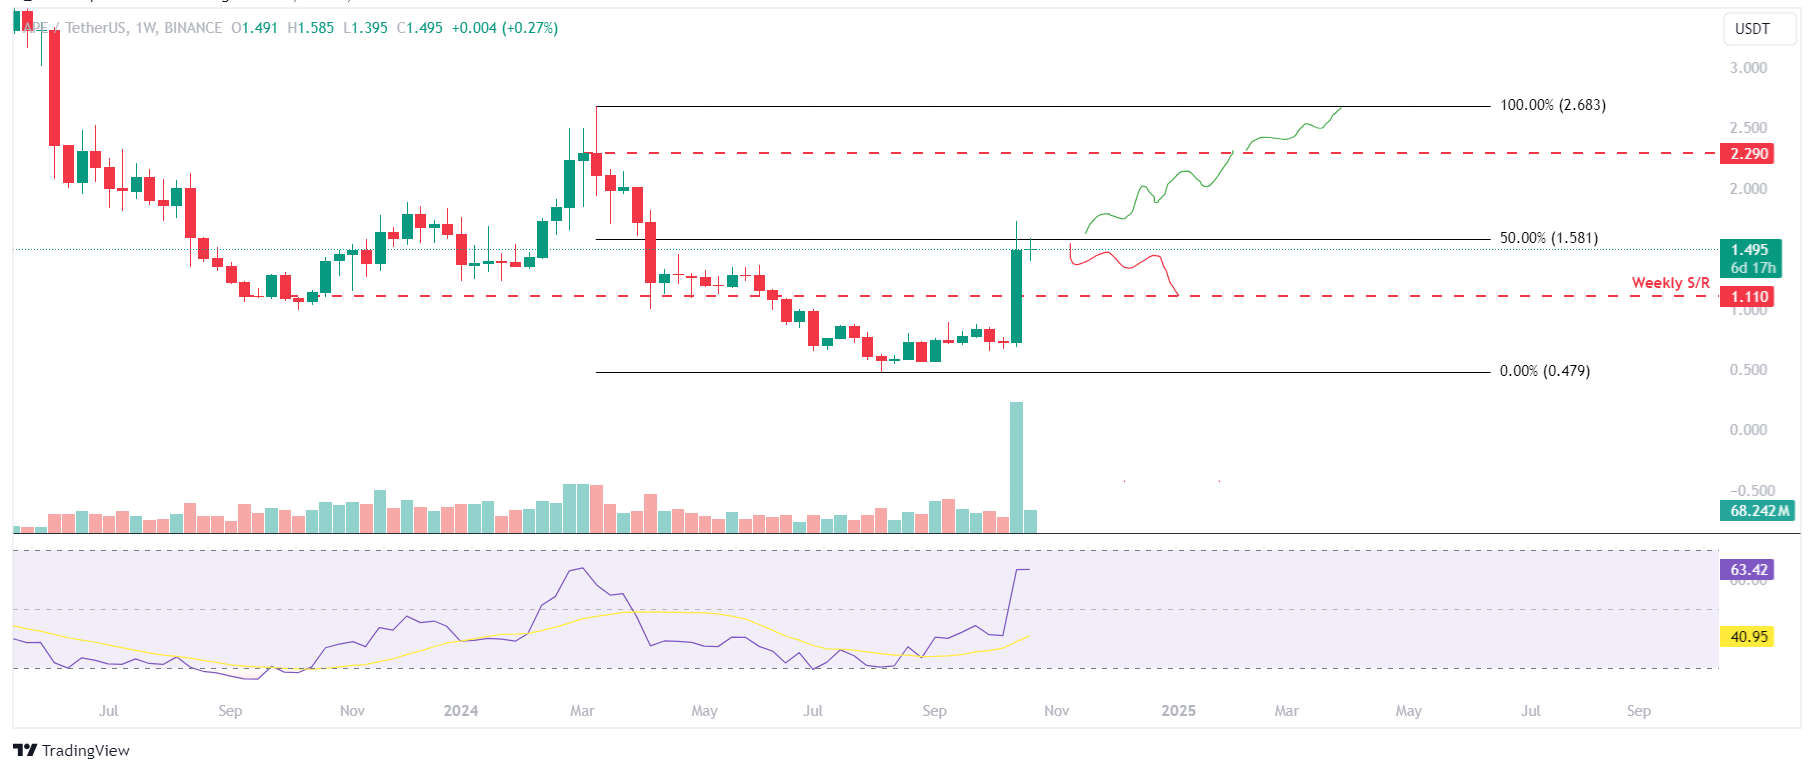
APE/USDT weekly chart
The daily chart also shows signs of strength after it broke and closed above the daily resistance level of $1.34 on Sunday. If APE continues rising, it could face the next resistance at its 61.8% Fibonacci retracement level at $1.84.
The RSI indicator on the daily chart is trading at 87, above the overbought level of 70. Traders are advised not to add to their long positions because there is a high chance of a pullback.
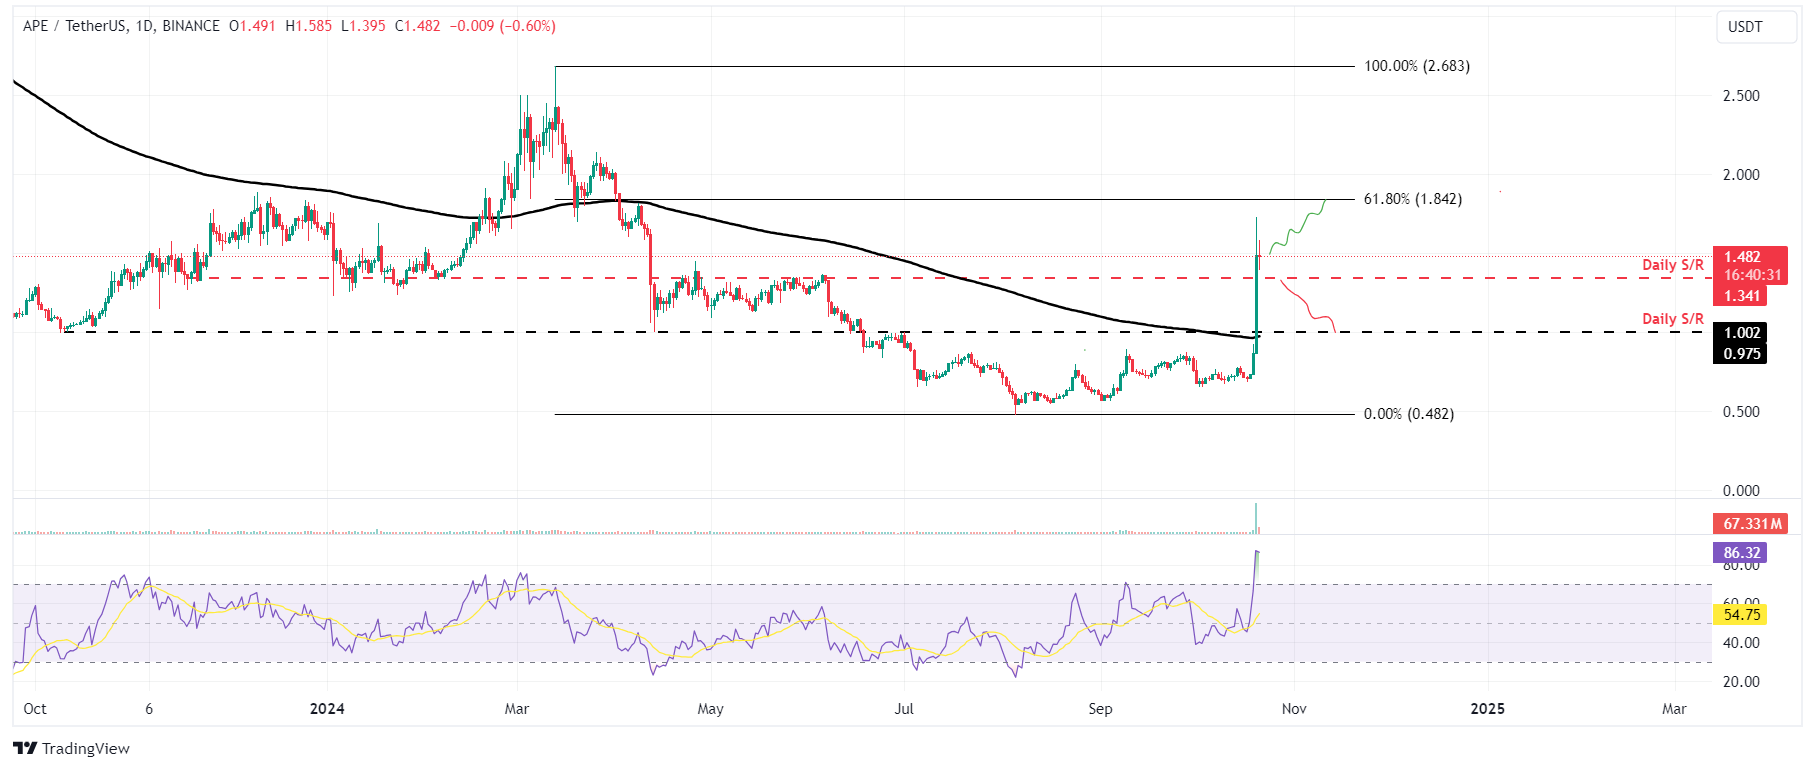
APE/USDT daily chart
However, if APE fails to find support around the daily support level of $1.34, it could extend the decline by 27% to retest its 200-day EMA support at $0.976, roughly coinciding with the next daily support level at $1.00.
Cryptocurrency metrics FAQs
The developer or creator of each cryptocurrency decides on the total number of tokens that can be minted or issued. Only a certain number of these assets can be minted by mining, staking or other mechanisms. This is defined by the algorithm of the underlying blockchain technology. On the other hand, circulating supply can also be decreased via actions such as burning tokens, or mistakenly sending assets to addresses of other incompatible blockchains.
Market capitalization is the result of multiplying the circulating supply of a certain asset by the asset’s current market value.
Trading volume refers to the total number of tokens for a specific asset that has been transacted or exchanged between buyers and sellers within set trading hours, for example, 24 hours. It is used to gauge market sentiment, this metric combines all volumes on centralized exchanges and decentralized exchanges. Increasing trading volume often denotes the demand for a certain asset as more people are buying and selling the cryptocurrency.
Funding rates are a concept designed to encourage traders to take positions and ensure perpetual contract prices match spot markets. It defines a mechanism by exchanges to ensure that future prices and index prices periodic payments regularly converge. When the funding rate is positive, the price of the perpetual contract is higher than the mark price. This means traders who are bullish and have opened long positions pay traders who are in short positions. On the other hand, a negative funding rate means perpetual prices are below the mark price, and hence traders with short positions pay traders who have opened long positions.
Information on these pages contains forward-looking statements that involve risks and uncertainties. Markets and instruments profiled on this page are for informational purposes only and should not in any way come across as a recommendation to buy or sell in these assets. You should do your own thorough research before making any investment decisions. FXStreet does not in any way guarantee that this information is free from mistakes, errors, or material misstatements. It also does not guarantee that this information is of a timely nature. Investing in Open Markets involves a great deal of risk, including the loss of all or a portion of your investment, as well as emotional distress. All risks, losses and costs associated with investing, including total loss of principal, are your responsibility. The views and opinions expressed in this article are those of the authors and do not necessarily reflect the official policy or position of FXStreet nor its advertisers. The author will not be held responsible for information that is found at the end of links posted on this page.
If not otherwise explicitly mentioned in the body of the article, at the time of writing, the author has no position in any stock mentioned in this article and no business relationship with any company mentioned. The author has not received compensation for writing this article, other than from FXStreet.
FXStreet and the author do not provide personalized recommendations. The author makes no representations as to the accuracy, completeness, or suitability of this information. FXStreet and the author will not be liable for any errors, omissions or any losses, injuries or damages arising from this information and its display or use. Errors and omissions excepted.
The author and FXStreet are not registered investment advisors and nothing in this article is intended to be investment advice.
Recommended Content
Editors’ Picks

TRUMP token leads $906 million in unlocks this week with over $330 million release
According to Tokenomist, 15 altcoins will unlock more than $5 million each in the next 7 days. Wu Blockchain data shows that the total unlocked value exceeds $906 million, of which the TRUMP token will unlock more than $330 million.

Why Mantra token’s dramatic 90% crash wiped out $5.2B market share
Mantra price hovered at $0.83 during the Asian session on Monday, following a massive 90% crash from $6.33 on Sunday. The crash wiped out $5.2 billion in the token’s market capitalization, quickly drawing comparisons to the infamous collapse of Terra LUNA and FTX in 2022.

Top 3 Price Prediction Bitcoin, Ethereum, Ripple: BTC is on the verge of a breakout while ETH and XRP stabilize
Bitcoin price approaches its key resistance level at $85,000 on Monday; a breakout indicates a bullish trend ahead. Ethereum and Ripple found support around their key levels last week, suggesting a recovery is in the cards.

Bitcoin and crypto market sees recovery as Fed official says agency ready to stabilize market if necessary
Bitcoin rallied 5% on Friday, trading just below $84,000 following Susan Collins, head of the Boston Federal Reserve (Fed), hinting that the agency could stabilize markets with "various tools" if needed.

Bitcoin Weekly Forecast: Market uncertainty lingers, Trump’s 90-day tariff pause sparks modest recovery
Bitcoin (BTC) price extends recovery to around $82,500 on Friday after dumping to a new year-to-date low of $74,508 to start the week. Market uncertainty remains high, leading to a massive shakeout, with total liquidations hitting $2.18 billion across crypto markets.

The Best brokers to trade EUR/USD
SPONSORED Discover the top brokers for trading EUR/USD in 2025. Our list features brokers with competitive spreads, fast execution, and powerful platforms. Whether you're a beginner or an expert, find the right partner to navigate the dynamic Forex market.