- ApeCoin price rebounds off support at $4.10 but runs out of steam below the 50-day SMA on the eight-hour chart.
- APE price flashes another sell signal amid dismal network activity.
- As exhibited by the MACD, a minor positive outlook could invalidate the continuation of the bear trend.
ApeCoin price is fighting for a breakout after a short bullish stint from its primary support at $4.10. According to short-term price analysis, APE faces mixed signals from technical and fundamental perspectives. Now, eyes are glued to the token’s ability to rise above acute seller congestion at $4.64.
Whales snuff out ApeCoin price bullish spark
As discussed, the TD Sequential indicator sent a buy signal on Friday, October 22, calling retail investors from the sidelines. However, whales remained stubbornly bearish, which curtailed the expected northbound move to $6.00 or even $6.50.
Insight from on-chain data provided by Santiment shows a continued drop in the number of addresses holding between 10,000 and 100,000 APE tokens. Only 1,367 addresses are still in this cohort compared to 2,359, as recorded on April 25.
 [16.40.41, 24 Oct, 2022]-638022163332205501.png)
ApeCoin Supply Distribution
ApeCoin price generally follows the actions of the whales, as observed from the above chart. Until whales stop this selling spree, therefore, movement to the upside could be capped by the 50-day SMA (Simple Moving Average), red.
The IOMAP on-chain model by IntoTheBlock paints a grim picture ahead for ApeCoin price. The red circles in the chart below represent holders who bought APE tokens in the respective price ranges.
If bulls manage to clear resistance at the 50 SMA, the 2,450 addresses which purchased $31.64 million APE tokens between $5.15 and $5.29 may consider selling to break even – a situation that could stifle growth and increase the risk of further declines.
-638022163764212069.png)
ApeCoin IOMAP chart
What’s next for ApeCoin price?
While a TD Sequential indicator’s buy signal triggered the move from $4.10 to $4.64, a sell signal from the same indicator screams doom for ApeCoin price. This call to offload APE manifested in a green nine candlestick, compelling sellers to take control again.
Apart from the seller congestion at the 50 SMA, sell orders are recommended if the high of candles six and seven in the count are exceeded by the high of bars eight or nine.
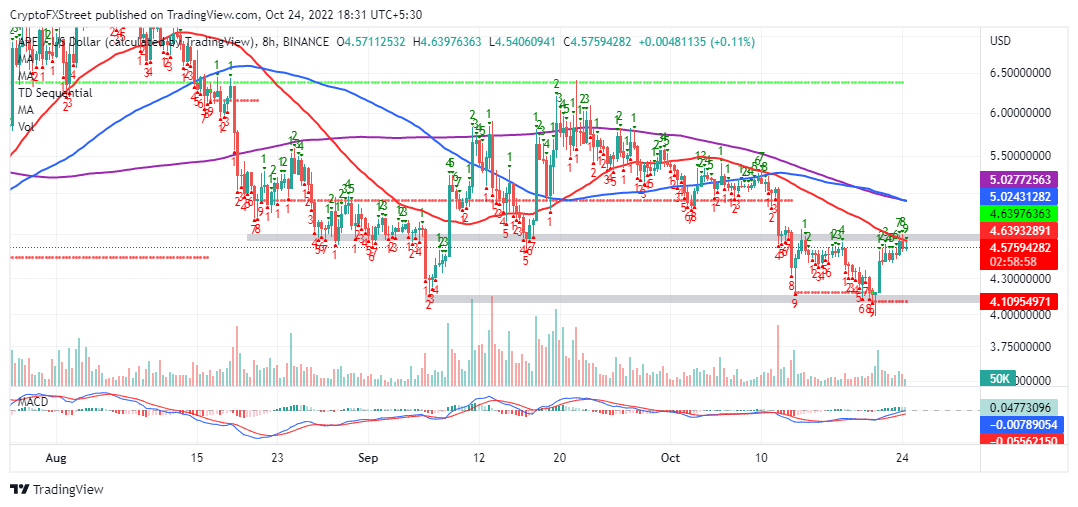
APE/USD eight-hour chart
On the bright side, the MACD (Moving Average Convergence Divergence (MACD) indicator exhibits an optimistic outlook as it lifts to the mean line. Traders looking for long positions should wait until the MACD crosses above the mean line (0.00) before activating their buy orders.
Moreover, the 12-day EMA (Exponential Moving Average) must sustain a gap above the 26-day EMA to cement the bulls’ influence on the ApeCoin price.
Information on these pages contains forward-looking statements that involve risks and uncertainties. Markets and instruments profiled on this page are for informational purposes only and should not in any way come across as a recommendation to buy or sell in these assets. You should do your own thorough research before making any investment decisions. FXStreet does not in any way guarantee that this information is free from mistakes, errors, or material misstatements. It also does not guarantee that this information is of a timely nature. Investing in Open Markets involves a great deal of risk, including the loss of all or a portion of your investment, as well as emotional distress. All risks, losses and costs associated with investing, including total loss of principal, are your responsibility. The views and opinions expressed in this article are those of the authors and do not necessarily reflect the official policy or position of FXStreet nor its advertisers. The author will not be held responsible for information that is found at the end of links posted on this page.
If not otherwise explicitly mentioned in the body of the article, at the time of writing, the author has no position in any stock mentioned in this article and no business relationship with any company mentioned. The author has not received compensation for writing this article, other than from FXStreet.
FXStreet and the author do not provide personalized recommendations. The author makes no representations as to the accuracy, completeness, or suitability of this information. FXStreet and the author will not be liable for any errors, omissions or any losses, injuries or damages arising from this information and its display or use. Errors and omissions excepted.
The author and FXStreet are not registered investment advisors and nothing in this article is intended to be investment advice.
Recommended Content
Editors’ Picks

Avalanche Price Prediction: AVAX targets $50 as BTC rally lifts Ethereum rivals
AVAX price breached the $40 resistance on Monday, driven by the crypto market's positive start to 2025. While on-chain data shows rising demand from large investors on the Avalanche network, technical indicators flash cautionary signals.

Bitcoin Price Forecast: Reclaims the $99K mark
Bitcoin (BTC) trades in green at around $99,200 on Monday after recovering almost 5% in the previous week. A 10xResearch report suggests BTC could approach its all-time high (ATH) of $108,353 ahead of Trump’s inauguration.

Sandbox Price Forecast: SAND bulls eyes for $1 mark
Sandbox price extends its gains on Monday after rallying more than 16% the previous week. On-chain data paints a bullish picture as SAND’s open interest and whale transactions are rising. A weekly candlestick close below $0.46 would invalidate the bullish thesis.

Filecoin bulls eye for double-digit gains
Filecoin, a decentralized storage network, extends its gain by 5% and trades around $6.20 on Monday after surging more than 19% the previous week. The main reason behind the rally is the announcement that Bithumb, the second largest exchange in South Korea, will add a new Filecoin trading pair on Monday.

Bitcoin: 2025 outlook brightens on expectations of US pro-crypto policy
Bitcoin price has surged more than 140% in 2024, reaching the $100K milestone in early December. The rally was driven by the launch of Bitcoin Spot ETFs in January and the reduced supply following the fourth halving event in April.

Best Forex Brokers with Low Spreads
VERIFIED Low spreads are crucial for reducing trading costs. Explore top Forex brokers offering competitive spreads and high leverage. Compare options for EUR/USD, GBP/USD, USD/JPY, and Gold.