- The crypto analyst who called the 2018 Bitcoin bottom is bullish on two altcoins that are poised for a breakout.
- Crypto market participants are hunting for the next 2x altcoin, after Bitcoin and Ethereum yielded massive gains over the past week.
- The expert argues that the ETH/BTC bottom is either in or extremely close, this is conducive to altcoin price rallies in the short term.
A crypto analyst who rose to fame for timing the 2018 Bitcoin bottom accurately, @Bluntz_Capital believes Ethereum alternatives and rival altcoins could yield 2x gains in the short term. The expert’s top picks are Fantom (FTM) and Frax Share (FXS), and he has identified bullish potential in these altcoins.
Also read: Ethereum Layer 2 rat race intensifies, here's how to benefit
Crypto analyst identifies altcoins primed to offer 2x gains
A crypto expert who gained popularity after predicting the 2018 Bitcoin bottom that the asset formed prior to its 2019 bull run. In the year 2018 when financial institutions like the US Federal Reserve were easing interest rates, Bitcoin price broke out higher after a bottom formation.
The 2018 Bitcoin bottom was therefore key to traders who booked profits in the asset’s 2019 bull run. Bluntz_Capital, a crypto expert and analyst recently noted that ETH/BTC bottom is either in or extremely close and informed his 221.9K followers that Ethereum is in the “buy zone” now.
In a 2022 tweet, the expert argued that if ETH/BTC ratio gets to 0.062 in Q1 2023, it affirms that the altcoin is in the buy zone. Typically, when an ETH/BTC ratio gets close to the bottom, there is a subsequent rally in altcoins, as seen in previous market cycles. This supports Bluntz_Capital’s bullish thesis for altcoins.
eth/btc 0.062 ✅
— Bluntz (@Bluntz_Capital) March 21, 2023
Q1 ✅
Bluntz now an ETH maxi ✅ https://t.co/nUf0Q1ApGx
Bluntz_Capital shared his optimism on Ethereum and his two altcoin gems with bullish potential. The analyst believes that Fantom (FTM) and Frax Share (FXS) are the two altcoins that are most likely to witness a bullish breakout in the short-term.
Why FTM and FXS?
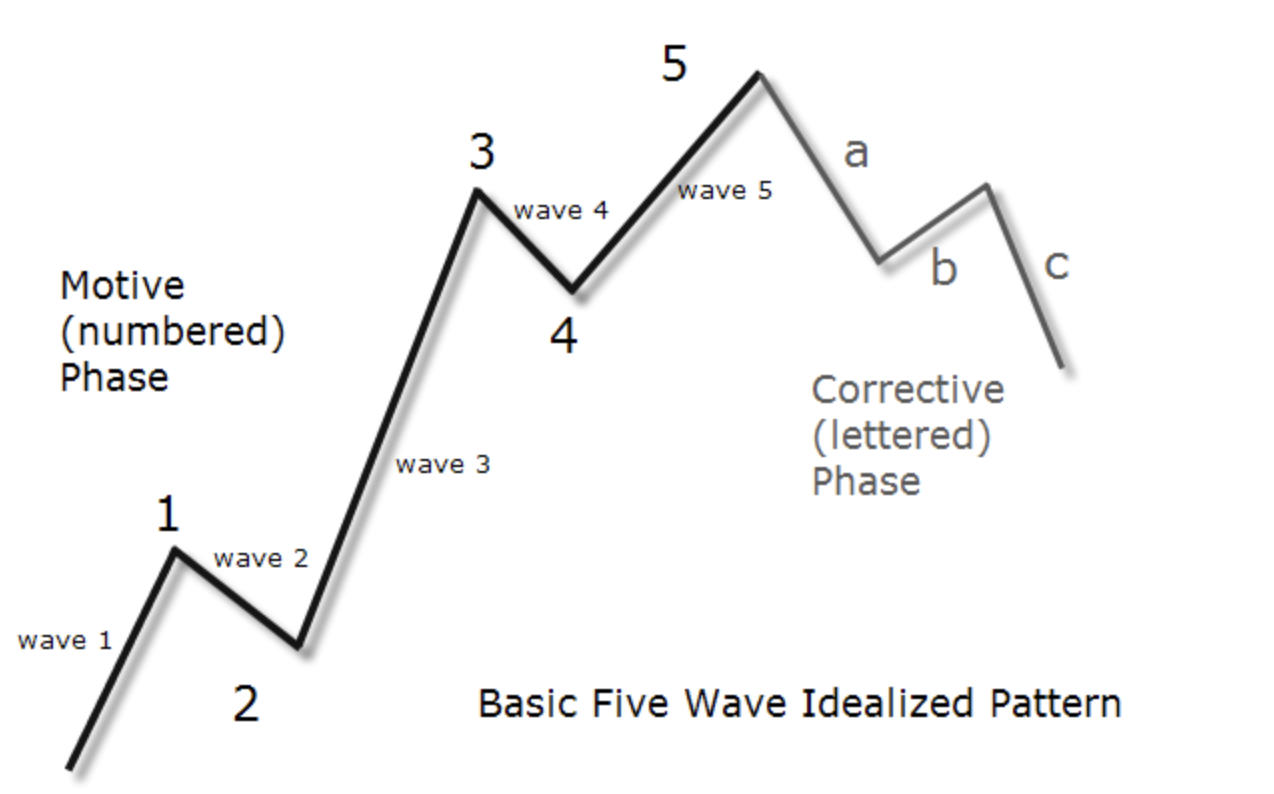
The technical expert uses Elliott Wave (EW) analysis to identify altcoins that have bullish potential. According to EW, a trending market moves in a five-three wave pattern, the first five waves are in the direction of the larger trend. After completion of five waves in one direction, a larger corrective move is expected in three consecutive waves. The second set of waves (corrective ones) are represented using letters and the first five using numbers.

Basic Elliott Wave Pattern
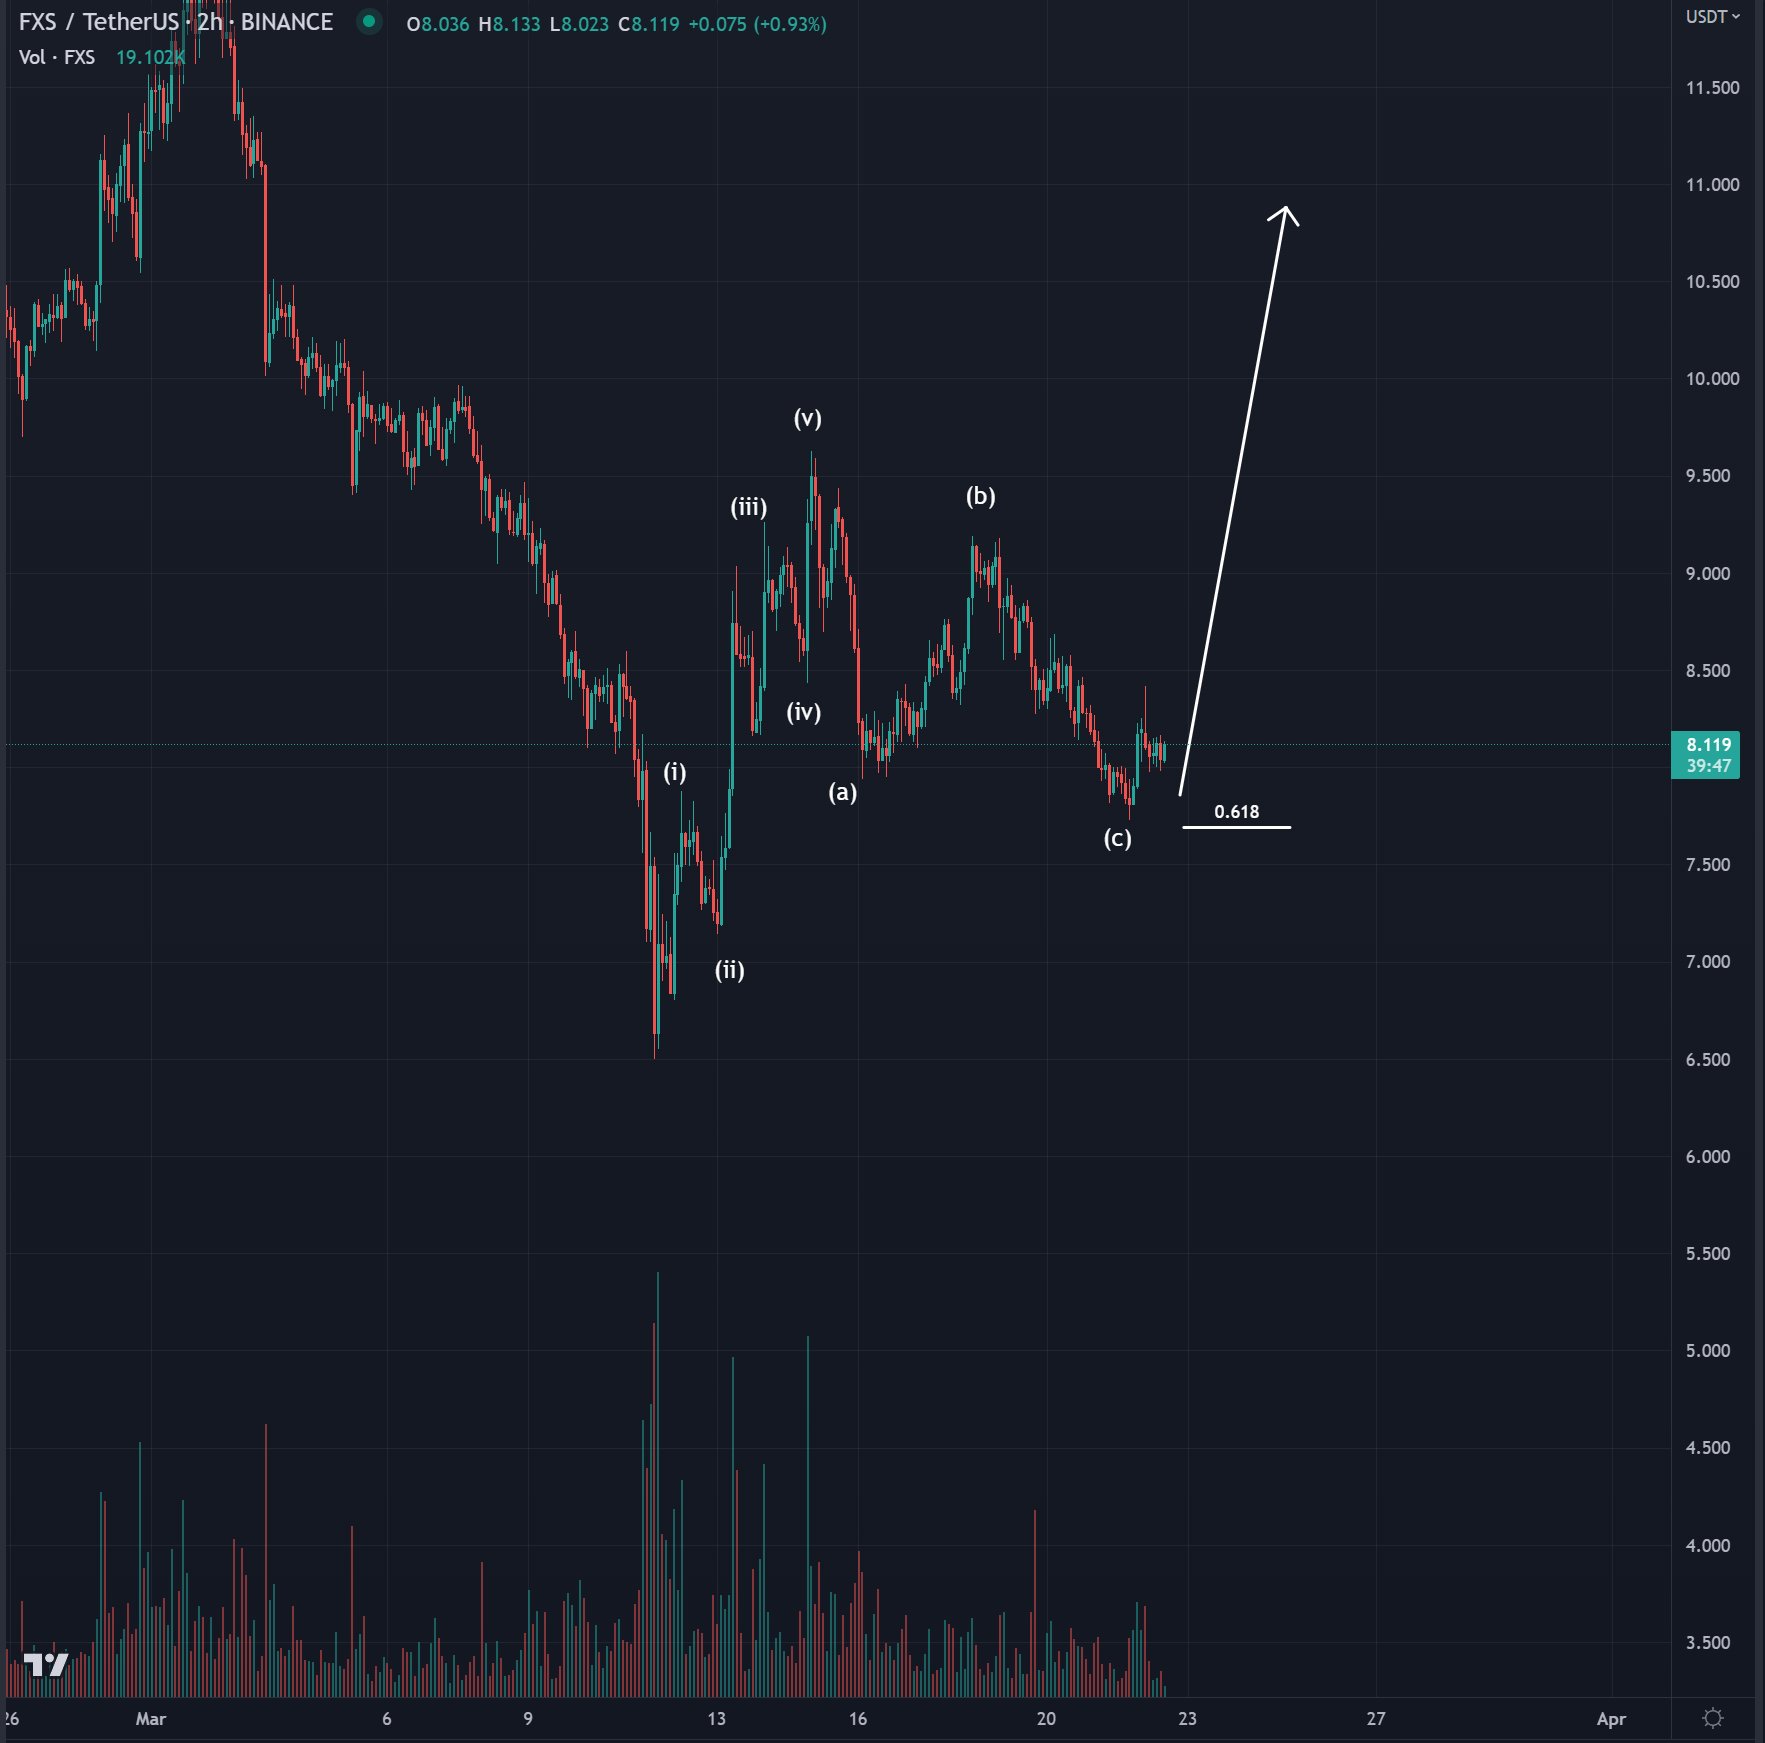
The analyst applied EW to FXS where five waves rose from the lows and three moved back down to the 61.8% Fibonacci Retracement level. Bluntz_Capital expects a trend continuation in FXS, upwards of 40% gains in the altcoin.

FXS/ USDT price chart
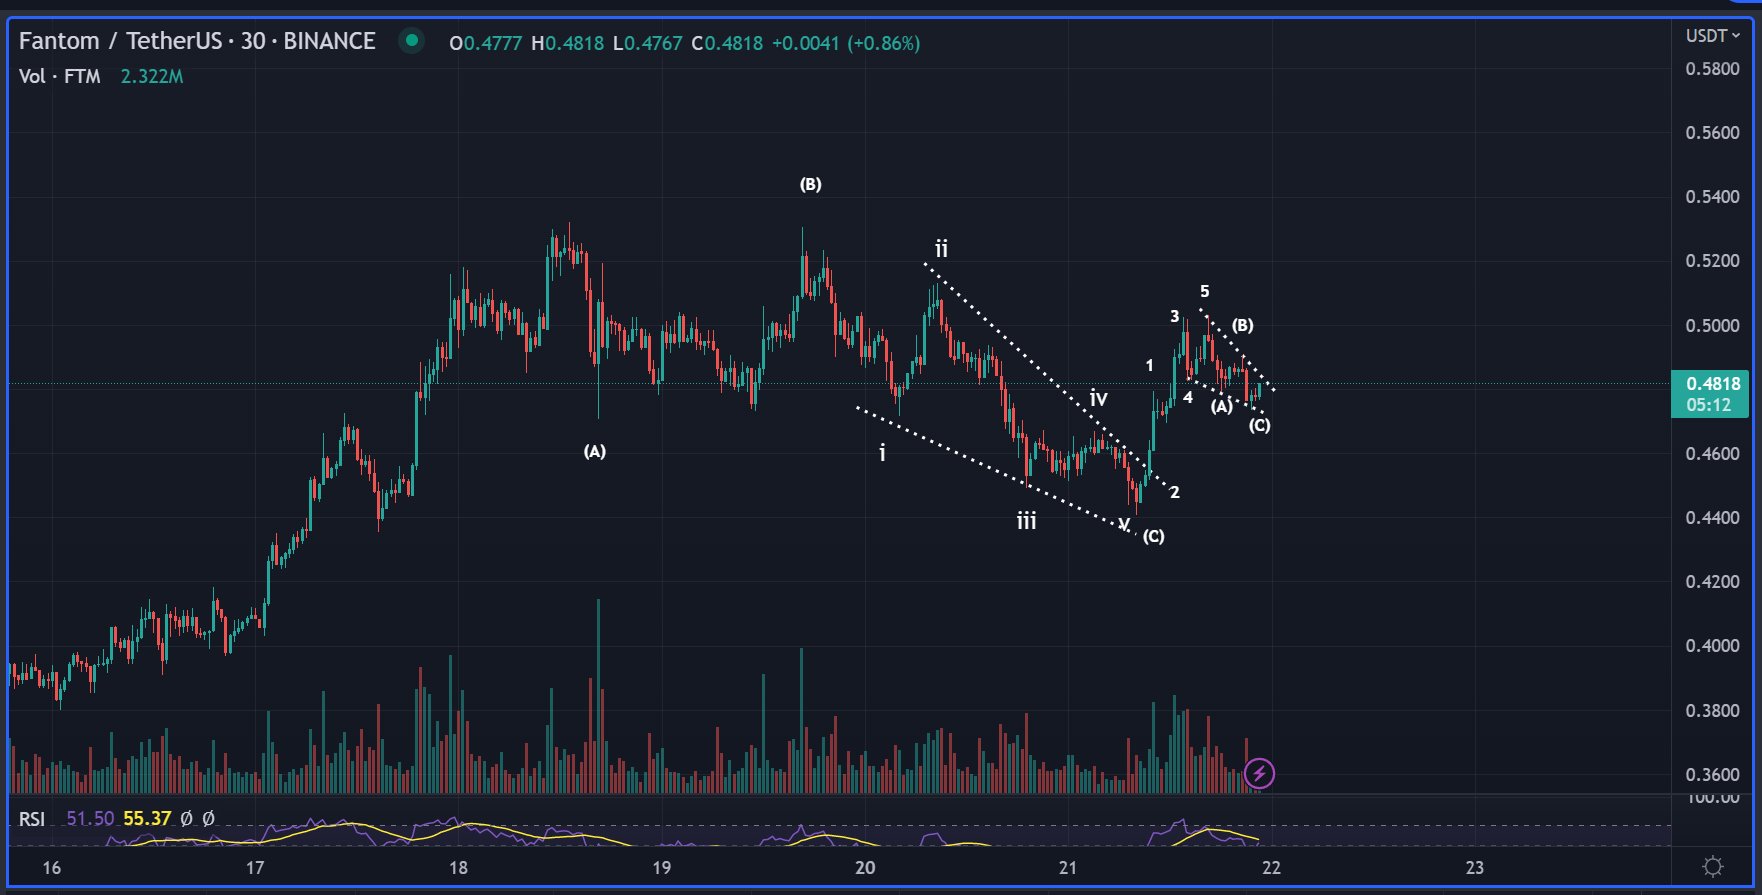
In the case of FTM, the expert recommends a long position in altcoin after noting a 17% dip, as seen in the price chart below.

FTM/USDT price chart
FTM completed its Elliot Wave pattern and the expert predicts a rally in the Ethereum rival in the short-term.
Information on these pages contains forward-looking statements that involve risks and uncertainties. Markets and instruments profiled on this page are for informational purposes only and should not in any way come across as a recommendation to buy or sell in these assets. You should do your own thorough research before making any investment decisions. FXStreet does not in any way guarantee that this information is free from mistakes, errors, or material misstatements. It also does not guarantee that this information is of a timely nature. Investing in Open Markets involves a great deal of risk, including the loss of all or a portion of your investment, as well as emotional distress. All risks, losses and costs associated with investing, including total loss of principal, are your responsibility. The views and opinions expressed in this article are those of the authors and do not necessarily reflect the official policy or position of FXStreet nor its advertisers. The author will not be held responsible for information that is found at the end of links posted on this page.
If not otherwise explicitly mentioned in the body of the article, at the time of writing, the author has no position in any stock mentioned in this article and no business relationship with any company mentioned. The author has not received compensation for writing this article, other than from FXStreet.
FXStreet and the author do not provide personalized recommendations. The author makes no representations as to the accuracy, completeness, or suitability of this information. FXStreet and the author will not be liable for any errors, omissions or any losses, injuries or damages arising from this information and its display or use. Errors and omissions excepted.
The author and FXStreet are not registered investment advisors and nothing in this article is intended to be investment advice.
Recommended Content
Editors’ Picks

Ripple update: XRP shows resilience in recent crypto market sell-off
Ripple's XRP is up 6% on Tuesday following a series of on-chain metrics, which reveals investors in the remittance-based token held onto their assets despite the wider crypto market sell-off last week.

Floki DAO floats liquidity provisioning for a Floki ETP in Europe
Floki DAO — the organization that manages the memecoin Floki — has proposed allocating a portion of its treasury to an asset manager in a bid to launch an exchange-traded product (ETP) in Europe, allowing institutional investors to gain exposure to the memecoin.

Six Bitcoin mutual funds to debut in Israel next week: Report
Six mutual funds tracking the price of bitcoin (BTC) will debut in Israel next week after the Israel Securities Authority (ISA) granted permission for the products, Calcalist reported on Wednesday.

Crypto Today: BTC hits new Trump-era low as Chainlink, HBAR and AAVE lead market recovery
The global cryptocurrency market cap shrank by $500 billion after the Federal Reserve's hawkish statements on December 17. Amid the market crash, Bitcoin price declined 7.2% last week, recording its first weekly timeframe loss since Donald Trump’s re-election.

Bitcoin: 2025 outlook brightens on expectations of US pro-crypto policy
Bitcoin price has surged more than 140% in 2024, reaching the $100K milestone in early December. The rally was driven by the launch of Bitcoin Spot ETFs in January and the reduced supply following the fourth halving event in April.

Best Forex Brokers with Low Spreads
VERIFIED Low spreads are crucial for reducing trading costs. Explore top Forex brokers offering competitive spreads and high leverage. Compare options for EUR/USD, GBP/USD, USD/JPY, and Gold.