• Binance Coin price emerged as the leader among the large-cap altcoins, rising by 7.35% in the span of 24 hours.
  • Fantom price noted a 5% increase as well, with the altcoin bouncing off a critical support line.
  • Bitcoin price, on the other hand, has been hovering around the $25,000 mark, looking to flip it into a support floor.

The crypto market has been exhibiting mixed signals, with the biggest cryptocurrency, Bitcoin, noting a minimal rise while altcoins take the lead. In line with the same, Binance Coin and Fantom stood among the few that pushed to keep the total value of all cryptocurrencies above $1 trillion.

Binance Coin price climbs toward key level

Binance Coin price could be seen inching closer toward the critical resistance at $334.7 after marking another 7.35% rise on Thursday. Trading at $327.6, the cryptocurrency simply needs more bullish support from traders to push the price to mark new 2023 highs.

The Moving Average Convergence Divergence (MACD) indicates a bullish crossover for BNB, which could support the case. But the Relative Strength Index (RSI) is also inching closer to the overbought zone above 70.0. This zone is usually indicative of either a trend reversal or pullback.
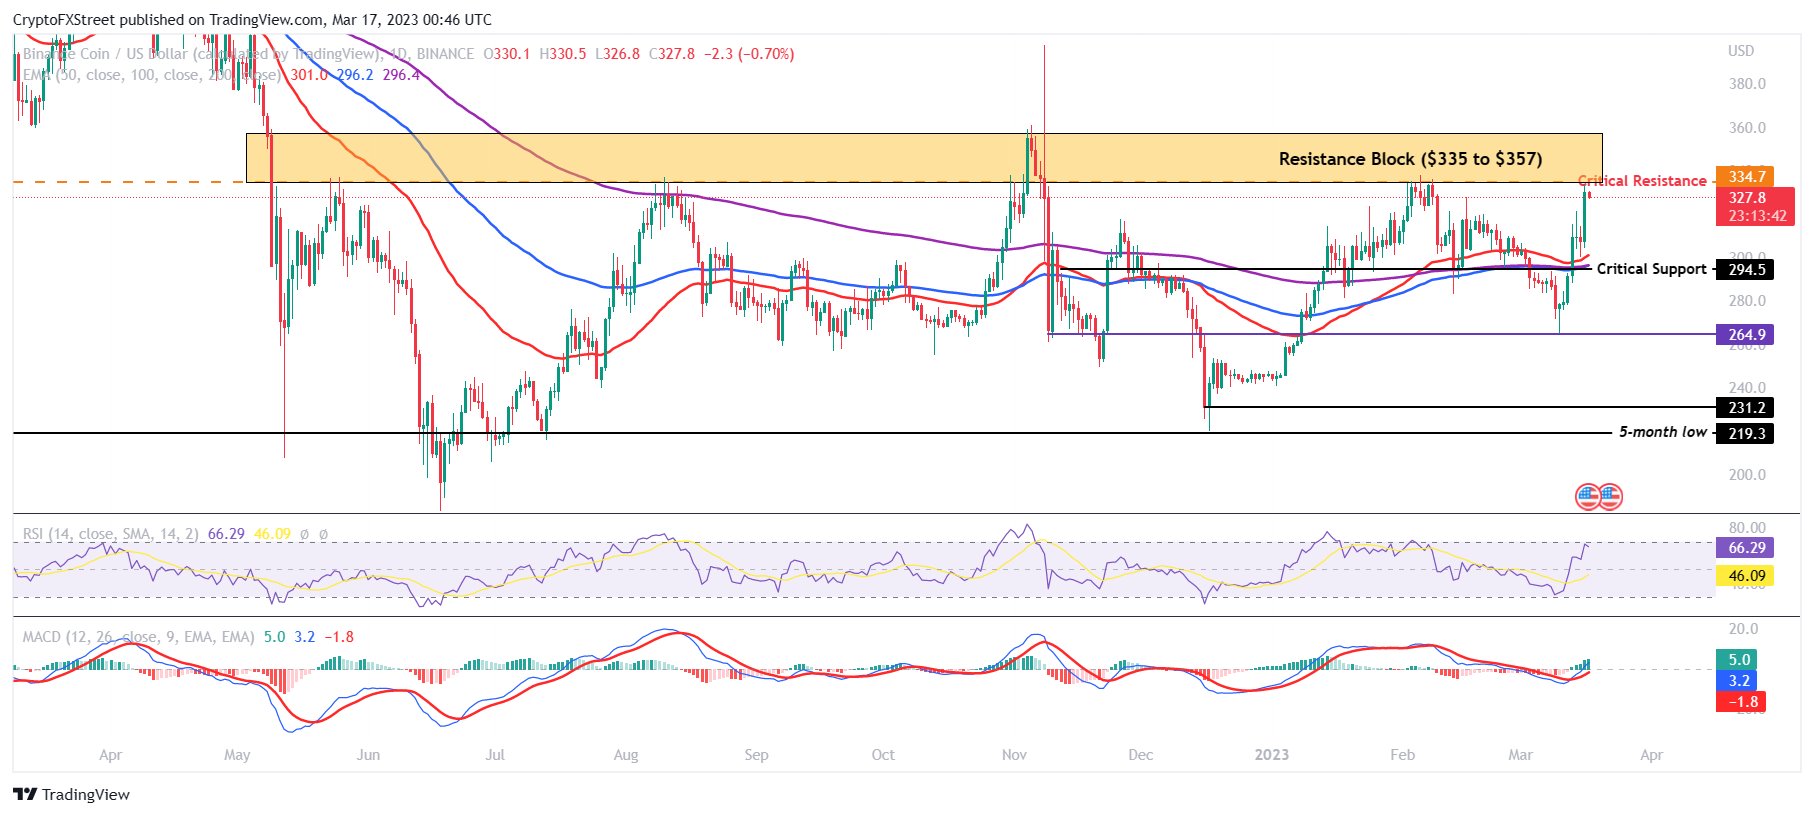
BNB/USD 1-day chart

BNB/USD 1-day chart

Thus if Binance Coin price corrects and declines below the critical support level at $294.5, it could crash to the year-to-date lows of $264.9. This would invalidate the bullish thesis and result in a 20% crash.

Fantom price saved in the nick of the time

Before marking a 5% increase on Thursday, Fantom price was just recovering the 12.9% decline noted just the day before. However, the green candle came in clutch and managed to keep it above the critical support at $0.386.

Trading at $0.4064, the altcoin is open to further rises, as indicated by theRSI. The indicator is at the neutral line at 50.0, and a flip of the same into support would likely trigger a positive reaction. Although in order to seal the bullishness, the Fantom price would need to breach the critical resistance level above $0.492.
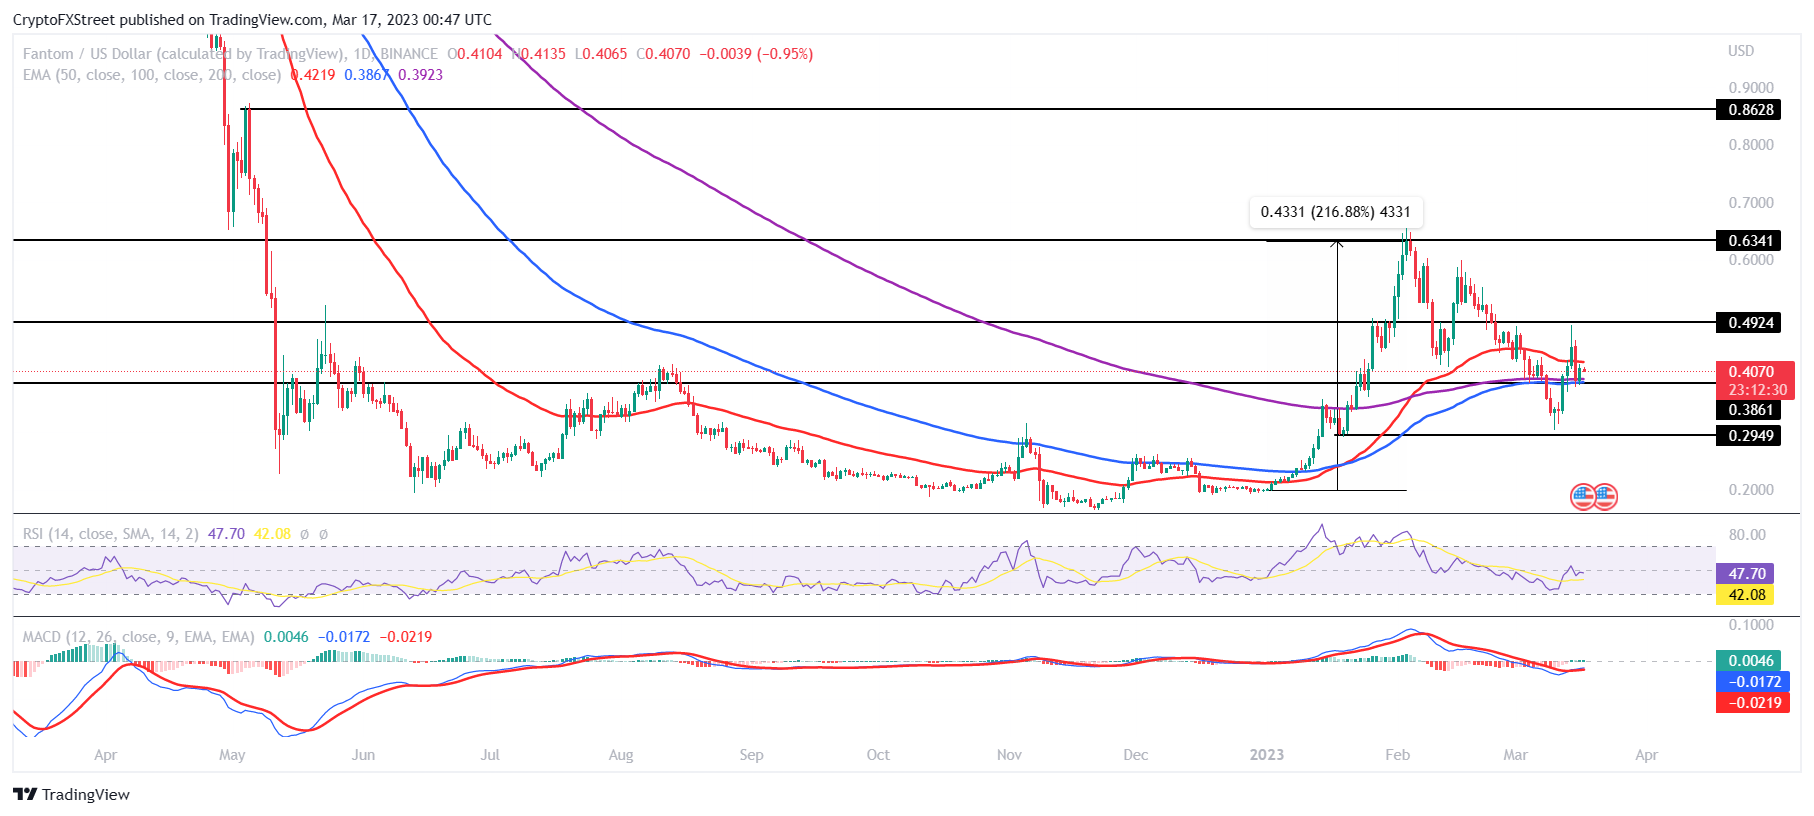
FTM/USD 1-day chart

FTM/USD 1-day chart

Failure to breach the same could result in a decline, and this time around, it could push FTM below the critical support at $0.386. This would invalidate the bullish thesis and also mark a 27% crash for the altcoin.


Information on these pages contains forward-looking statements that involve risks and uncertainties. Markets and instruments profiled on this page are for informational purposes only and should not in any way come across as a recommendation to buy or sell in these assets. You should do your own thorough research before making any investment decisions. FXStreet does not in any way guarantee that this information is free from mistakes, errors, or material misstatements. It also does not guarantee that this information is of a timely nature. Investing in Open Markets involves a great deal of risk, including the loss of all or a portion of your investment, as well as emotional distress. All risks, losses and costs associated with investing, including total loss of principal, are your responsibility. The views and opinions expressed in this article are those of the authors and do not necessarily reflect the official policy or position of FXStreet nor its advertisers. The author will not be held responsible for information that is found at the end of links posted on this page.

If not otherwise explicitly mentioned in the body of the article, at the time of writing, the author has no position in any stock mentioned in this article and no business relationship with any company mentioned. The author has not received compensation for writing this article, other than from FXStreet.

FXStreet and the author do not provide personalized recommendations. The author makes no representations as to the accuracy, completeness, or suitability of this information. FXStreet and the author will not be liable for any errors, omissions or any losses, injuries or damages arising from this information and its display or use. Errors and omissions excepted.

The author and FXStreet are not registered investment advisors and nothing in this article is intended to be investment advice.

Recommended content


Recommended Content

Editors’ Picks

Ethereum has lost its “ultra” sound money status, faces key rectangle resistance hurdle

Ethereum has lost its “ultra” sound money status, faces key rectangle resistance hurdle

Ethereum is up 0.5% on Thursday following a recent analysis showing that the top altcoin lost its "ultra" sound money narrative. Meanwhile, ETH ETFs recorded net inflows for the first time after nine days of consecutive outflows.

More Ethereum News
Solana bears dominate market as SunPump has potentially led to less demand for SOL

Solana bears dominate market as SunPump has potentially led to less demand for SOL

Solana is down 2.5% on Thursday following bearish signals across its funding rate and total fees captured. SOL's weak performance could also be linked to the declining traction seen in its meme coin generation platform Pump.fun.

More Solana News
AI tokens see narrow gains as Wall Street banks raise price targets on NVDA

AI tokens see narrow gains as Wall Street banks raise price targets on NVDA

AI tokens NEAR, ICP, RENDER and TAO briefly traded in the green on Thursday following Wall Street banks' positivity toward Nvidia's earnings report. While a correction followed, these tokens could rally if NVDA meets expectations.

More Cryptocurrencies News
XRP back above $0.57 even as Ripple traders take $8 million in profits

XRP back above $0.57 even as Ripple traders take $8 million in profits

Ripple (XRP) traders have consistently taken profits on their holdings in the last two weeks, per Santiment data. Once again, traders have grabbed $8.36 million in profit so far on Thursday. Typically, profit-taking negatively influences the asset as it increases the selling pressure. 

More Ripple News
Bitcoin: Will BTC continue its ongoing decline?

Bitcoin: Will BTC continue its ongoing decline?

Bitcoin (BTC) trades above $59,000 on Friday, but it has lost 7.5% this week so far after being rejected around the daily resistance of $65,000. The decline is supported by lower demand from the US spot Bitcoin ETFs, which registered a net outflow of $103.8 million, falling Bitcoin's Coinbase Premium Index, and a spike in Network Realized Profit/Loss. However, some investors seem to be taking the chance to buy BTC amid this price dip, as shown by the Exchange Netflow data.

Read full analysis
Moneta Markets review 2024: All you need to know

Moneta Markets review 2024: All you need to know

VERIFIED In this review, the FXStreet team provides an independent and thorough analysis based on direct testing and real experiences with Moneta Markets – an excellent broker for novice to intermediate forex traders who want to broaden their knowledge base.

Read More

BTC

ETH

XRP