Algorand Price Prediction: ALGO at inflection point as bulls face stiff supply barrier
- Algorand price faces a wide area of resistance after surging nearly 16%.
- ALGO needs to clear the supply zone that extends from $1.50 to $1.63 to have any chance of surging higher.
- A 15% downtrend to $1.25 is likely if the buyers fail to shatter the said resistance level.

Algorand price faces a blockade that has rejected it multiple times over the past months. Now ALGO is trying to take another jab at this level.
Algorand price at a decisive moment
The 12-hour chart shows Algorand price stuck between $0.97 and $1.54 for almost three months. Although there were a few deviations from bulls trying to break out, they were hammered down.
At the time of writing, ALGO surged nearly 34% in under ten days and is steadily heading toward the supply zone that stretches from $1.50 to $1.63. A break out above this area will signal that the bullish momentum has overwhelmed the market sellers.
Under these conditions, Algorand price could rise 10% to retest the recent swing high at $1.79 or the pivot point on February 12 at $1.84.
If the bullish momentum persists beyond this point, ALGO could easily swing 23% to tag the 161.8% Fibonacci extension level at $2.21.
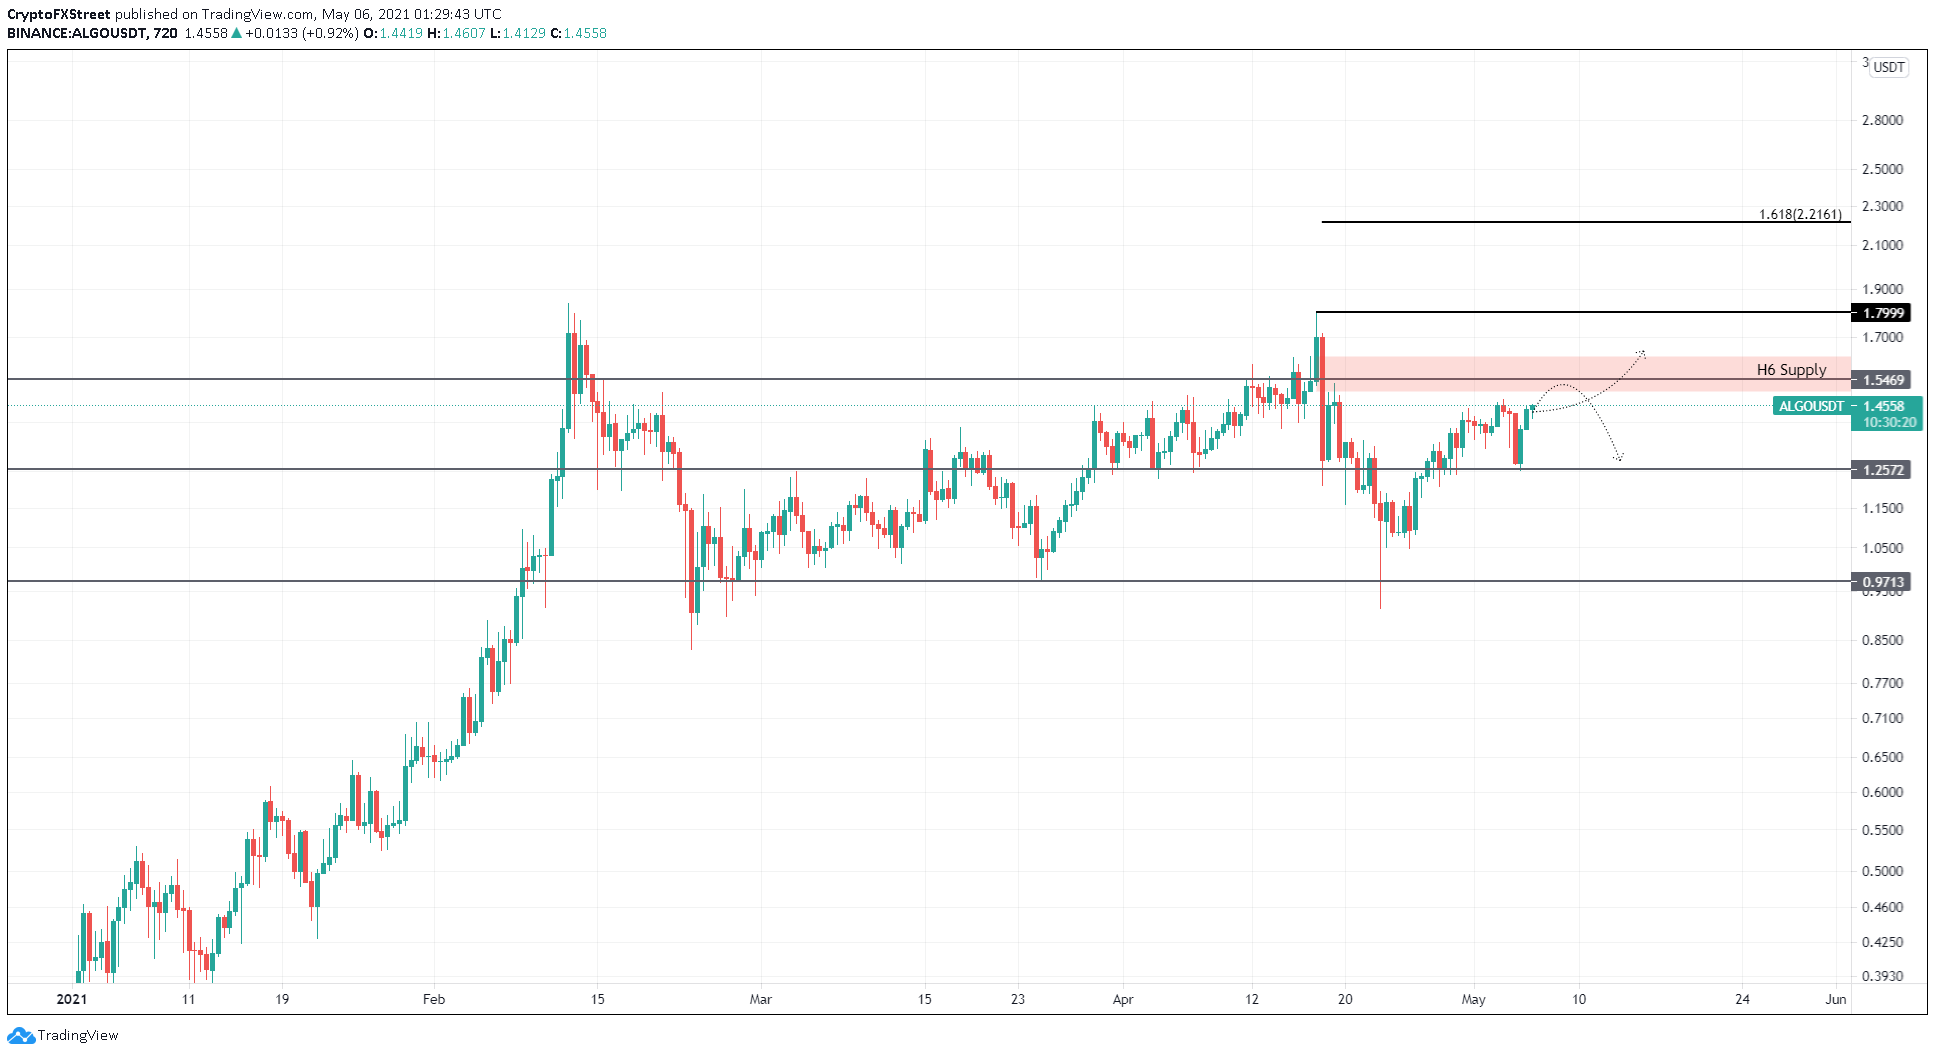
ALGO/USDT 12-hour chart
The bullish thesis mentioned above depends solely on the fact that buyers overwhelm the sellers and break through the supply zone. However, if the momentum falls short, sellers could trigger a 15% downtrend to $1.25.
A breakdown of this level would invalidate the optimistic scenario and kick-start another 15% downswing to $1.07.
Author

Akash Girimath
FXStreet
Akash Girimath is a Mechanical Engineer interested in the chaos of the financial markets. Trying to make sense of this convoluted yet fascinating space, he switched his engineering job to become a crypto reporter and analyst.


