Algorand price in a bullish triangle, ready to make 25% gains
- Algorand price action made a false break in early morning trade but saw bulls back in the triangle.
- ALGO price looks set to complete the triangle by next week, set for a bullish breakout towards $1.20.
- With the ascending side tested three times and the upper base twice, expect the third test to be the breakout one.

Algorand (ALGO) has been starting its uptrend since the fall in January, bouncing off $0.80 and the monthly S2 support level. Since then, ALGO price action has been trading sideways to higher, forming a bullish triangle with the ascending side at the bottom already tested twice these past few days and the base to the upside at $1.10 tested twice in a row for resistance. Expect the triangle to be completed by next week with a bullish breakout even sooner if global markets can shake off the inflation concerns from yesterday, and hit $1.20 to the upside.
Algorand bulls can play this patiently or await needed tailwinds to speed up
Algorand bulls are in a comfortable position today after some nervousness this morning. With the global rout in financial markets, ALGO price slipped out of the bullish triangle that has been formed since the end of January. But in the meantime, bulls have picked up the dip and made it a false break, squeezing out some bears in the process.
ALGO price offers bulls two scenarios to let this triangle play out: the first, a slow grind and completion of the triangle towards the end of next week, with a squeeze against the $1.10 baseline and then a pop above towards $1.20. The second, a quicker process once global indices are back in the green, with Nasdaq leading the charge, and a breakout as early as today. Whatever the scenario, the price target is set at $1.20, with the monthly pivot just a few ticks away from the S1 support from January, making it a vital zone for resistance.
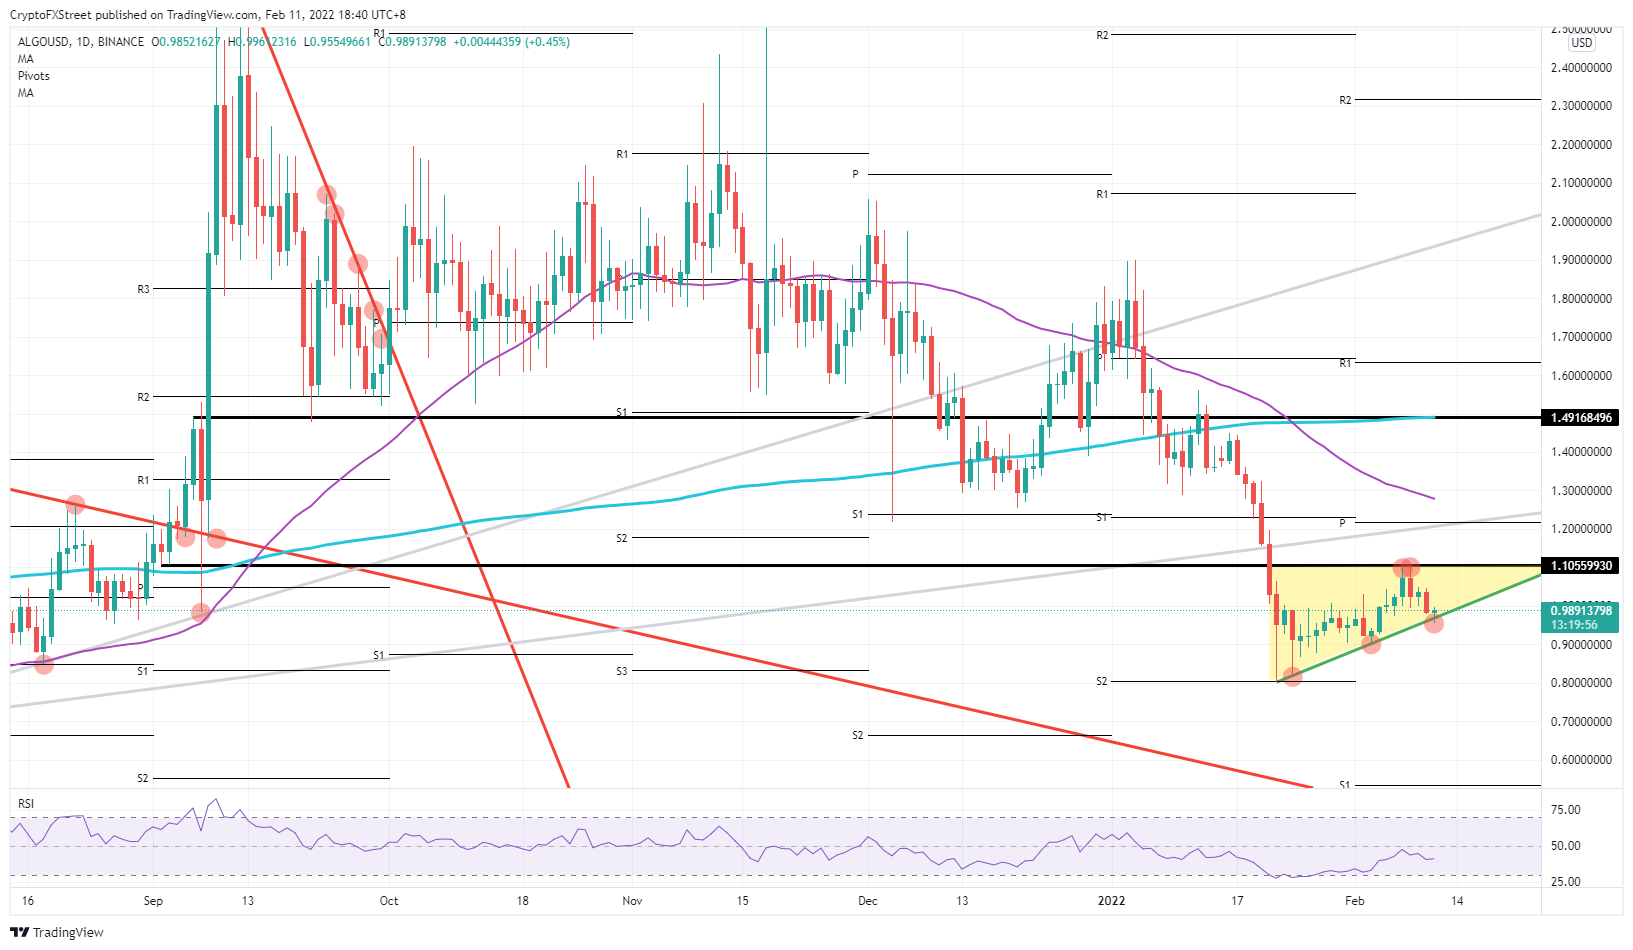
ALGO/USD daily chart
With the false breakout this morning, the tilted side of the triangle has already lost some importance and support. Expect another push from bears on that level to set the scene for a solid break out of the triangle to the downside. The loss could result in a 15% drop towards $0.80, which falls in line with the start of the triangle and the S2 support from January.
Author

Filip Lagaart
FXStreet
Filip Lagaart is a former sales/trader with over 15 years of financial markets expertise under its belt.


