After the recent pump and dump, where will Ethereum price go next?
- Ethereum price indicates the possibility of a minor bounce on a short-term outlook.
- The macro outlook for ETH shows that there is a potential for a 30% crash to $1,300.
- On-chain metrics suggest that the smart contract token could continue to bracket between $1,700 and $2,200.

Ethereum price has flipped its direction on the three-hour chart, undoing gains seen between May 28 and 31. While this correction might seem bearish, it could trigger a minor relief rally before a massive crash to significant levels.
Ethereum price and scalping opportunity
Ethereum price set a swing low at $1,702 on May 12, triggering a minor recovery. Since this point, ETH has been consolidating, producing lower highs and lower lows. The three-hour chart shows that the $1,731 support level that catalyzed an 18% uptrend between May 28 and 31 reached its upside potential at $2,020.
Due to the exhaustion of bullish momentum, ETH took a U-turn and undid all the gains by retesting the $1,731 barrier. As Ethereum price trades here, two bullish outlooks can occur:
- A bounce off the $1,813 support floor
- A sweep of the $1,731 foothold, collecting the sell-stop liquidity
For both scenarios, the outcome is bullish for Ethereum price with take-profit levels at $2,164 and the high time frame hurdles at $2,341 and $2,412.
Considering the short-term relief rally for Bitcoin could retest the $35,180, it would be logical to assume that the Ethereum price follow its lead. Therefore, a move to high time frame hurdles at $2,412 would amount to a 40% upswing.
This move would be a perfect decoy for smart investors or market makers, as this would get retail traders invested in the bullish outlook. Hence, a reversal in the trend around $2,412 would catch these participants off-guard. If this reversal occurs, pushing Ethereum price below $1,730, it can be aptly termed a dead cat bounce, suggesting that the macro bearish outlook would continue.
Macro outlook reveals more threats for ETH
Ethereum price seems to be stuck in time as it consolidates around the $1,730 weekly support level. From its all-time high at $4,864, ETH has crashed 65% and set a swing low at $1,703. This downswing was exacerbated after the recent breakdown from a bear flag.
This technical pattern contains a massive downswing that forms the flagpole and is often followed by a flag, which is when the asset consolidated with higher highs and higher lows. The bear flag forecasts a 49% downswing to $1,298, obtained by adding the flagpole’s height to the breakout point. On May 8, Ethereum price produced a daily candlestick close below the flag’s lower trend line at $2,500, revealing a bearish breakout.
As it hovers around the $1,730 support floor, the threat of a 30% downswing to retest the theoretical target at $1,298 remains.
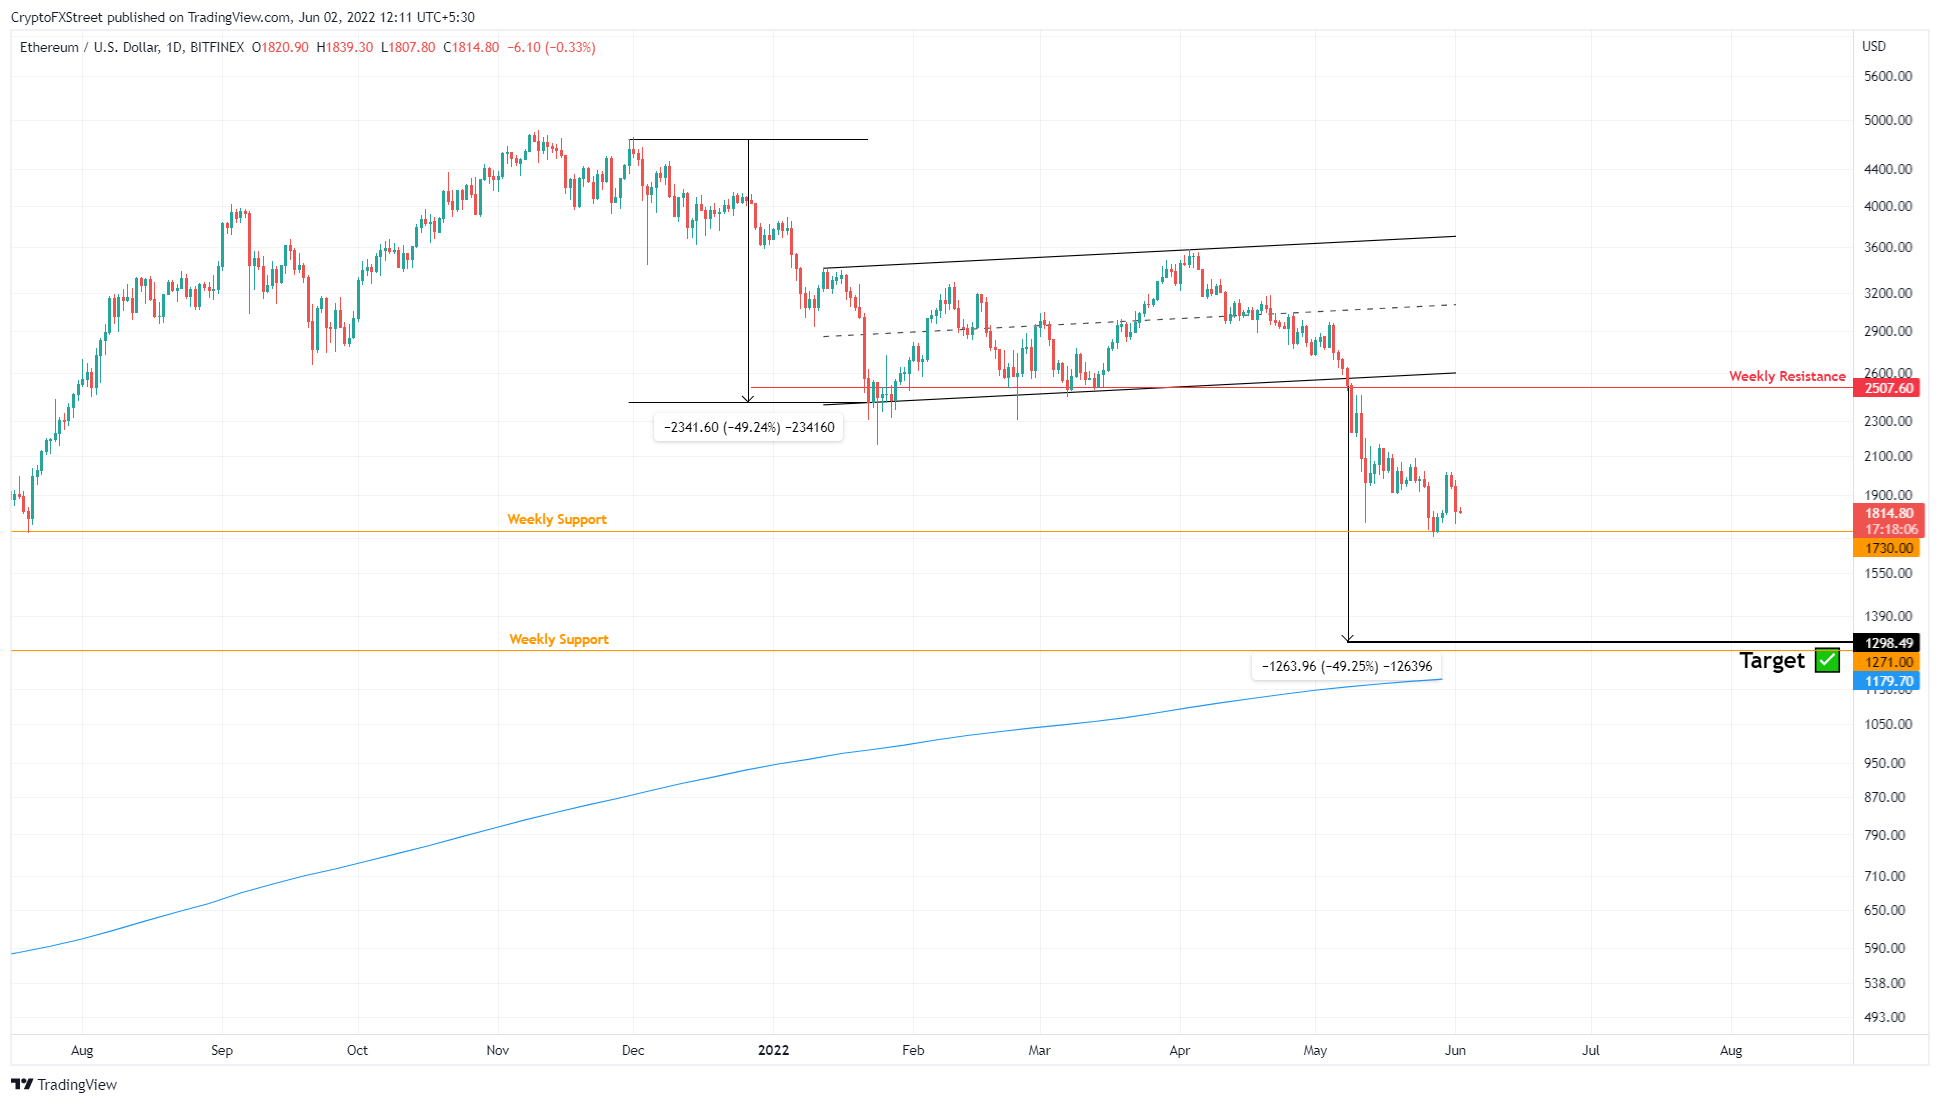
ETH/USD 1-day chart
Supporting the bearish outlook for Ethereum price is IntoTheBlock’s Global In/Out of the Money (GIOM) model. This index shows that the upside for Ethereum is capped by a cluster of underwater investors that extends from $1,940 to $2,188.
Here, roughly 3 million addresses that purchased 12 million ETH at an average price of $2,038 are “Out of the Money.”
Adding further credence is the immediate support level, ranging from $1,565 to $1,795, where only 1.9 million addresses purchased 3 million ETH. Relatively, this support floor is weak and could easily run over if the selling pressure spikes. Hence, the downtrend is the most likely outcome.
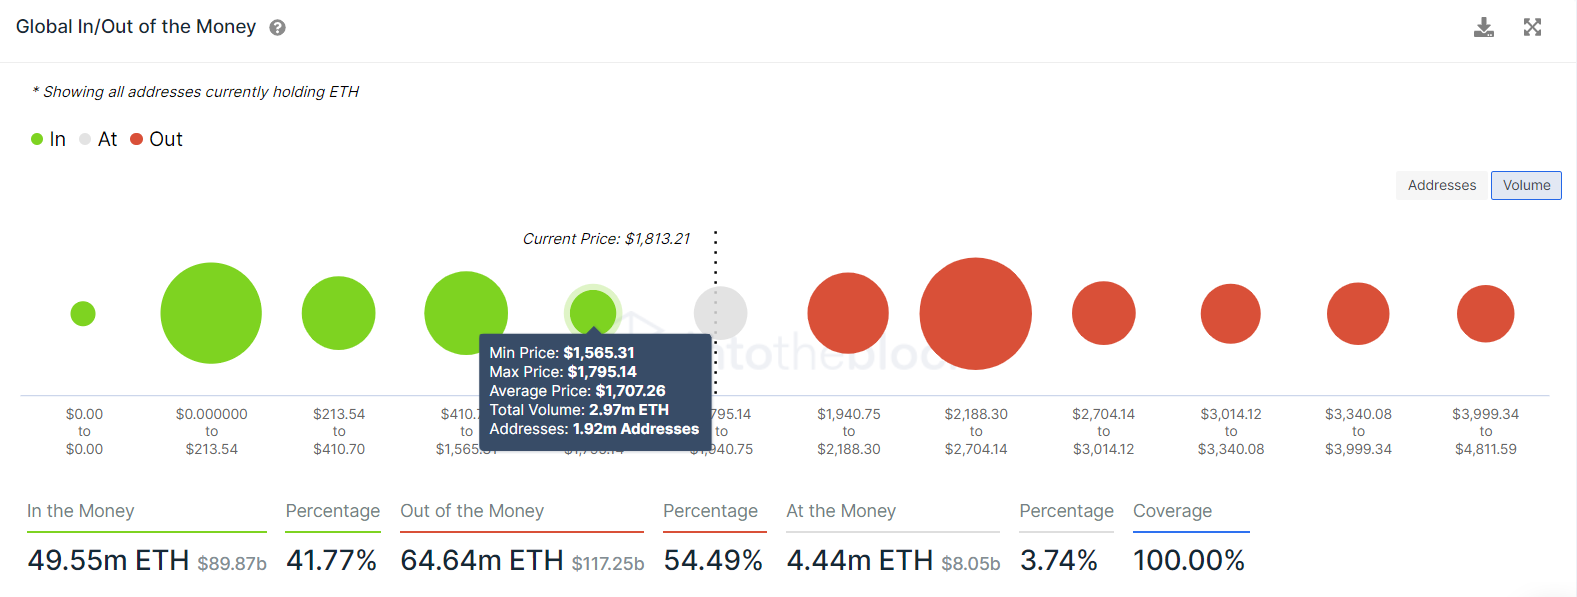
ETH GIOM
The icing on this bearish cake is the declining new addresses joining the Ethereum network. The 7-day moving average of new addresses has plummeted from 165,000 on November 3, 2021, to 71,541 on June 1, 2022.
This 56% crash indicates that investors are not interested in Ethereum price at the current level and could also indicate capital flight, further strengthening the macro bearish outlook.
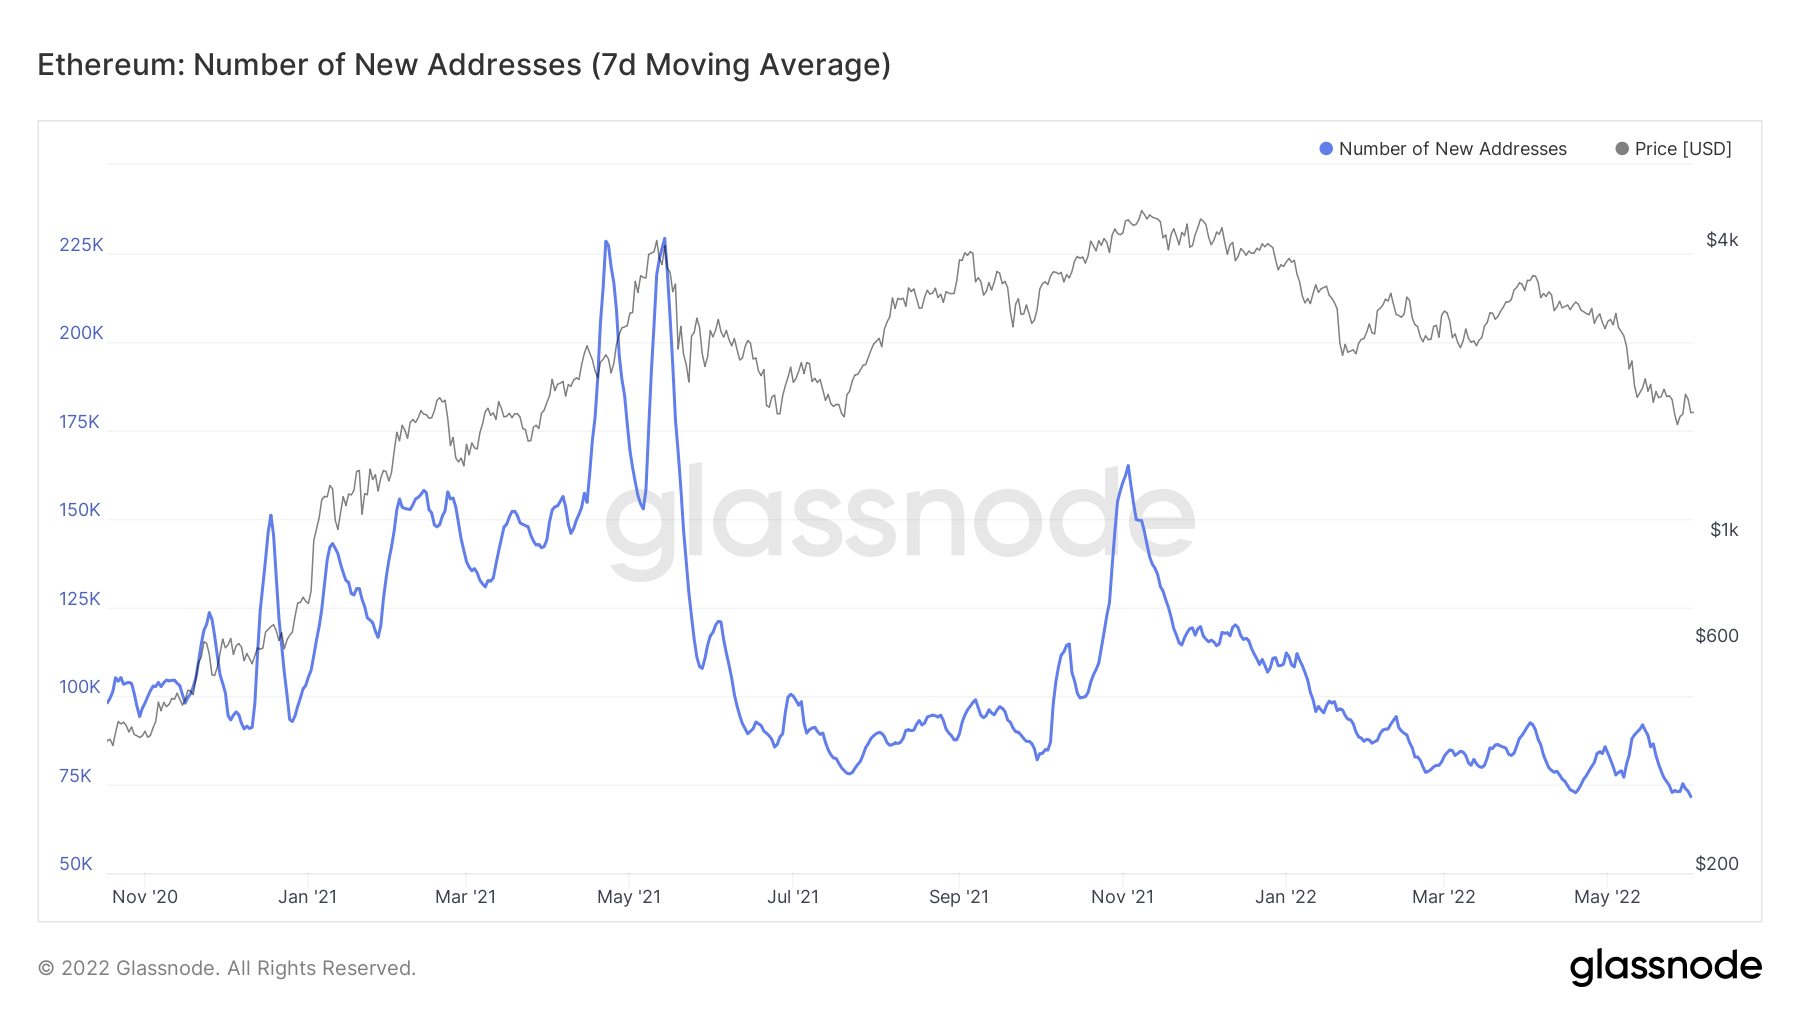
ETH new addresses
While the short-term outlook predicts a minor bounce or a relief rally, investors need to be cautious as it could catch them off-guard when the macro bearish outlook sets in.
The high time frame outlook for ETH can turn bullish and completely obliterate the bears if the Ethereum price produces a daily candlestick close above $3,578. This development would indicate a higher high and allow sidelined buyers to step in.
However, market participants can wait for the weekly candlestick to close above the same level, which could serve as a secondary confirmation of the bull run’s start. In such a case, users can expect the Ethereum price to make a run for the $4,000 psychological level.
Author

Akash Girimath
FXStreet
Akash Girimath is a Mechanical Engineer interested in the chaos of the financial markets. Trying to make sense of this convoluted yet fascinating space, he switched his engineering job to become a crypto reporter and analyst.


