- AAVE's price is trading below its daily support level at $142.69; a firm close below would suggest a decline ahead.
- Santiment's Network Realized Profit/Loss data shows investors are booking profits.
- A daily candlestick close above $164.32 would invalidate the bearish thesis.
Aave (AAVE) shows weakness on Wednesday, trading in the red after a loss of over 7% the previous day. It is currently trading below a key support level, and a sustained close beneath this level could indicate further declines. Additionally, AAVE's Network Realized Profit/Loss data shows that investors are taking profits, suggesting a potential price decline in the coming days.
AAVE price shows signs of weakness
AAVE price broke below the ascending trendline (drawn by connecting multiple low levels for mid-August) on Tuesday. As of Wednesday, it continues to trade down around $141.19, breaking below its daily support level of $142.69.
Suppose AAVE's price closes below its $142.69 daily support and its 50-day Exponential Moving Average (EMA) around $139.47. It could extend its decline by 17% from its current trading level to retest its 61.8% Fibonacci retracement (drawn from an early August low of $76.15 to its late September high of $180.70) at $116.09.
The Moving Average Convergence Divergence (MACD) indicator further supports AAVE's fall, signaling a bearish crossover on Monday. The MACD line has moved below the signal line to provide us with a sell signal. It also shows red histogram bars below the neutral line at zero, suggesting that AAVE's price could experience downward momentum.
Additionally, the Relative Strength Index (RSI) on the daily chart has fallen sharply to 43, below its neutral level of 50. A cross to levels below the neutral level generally indicates that bearish momentum is gaining traction.
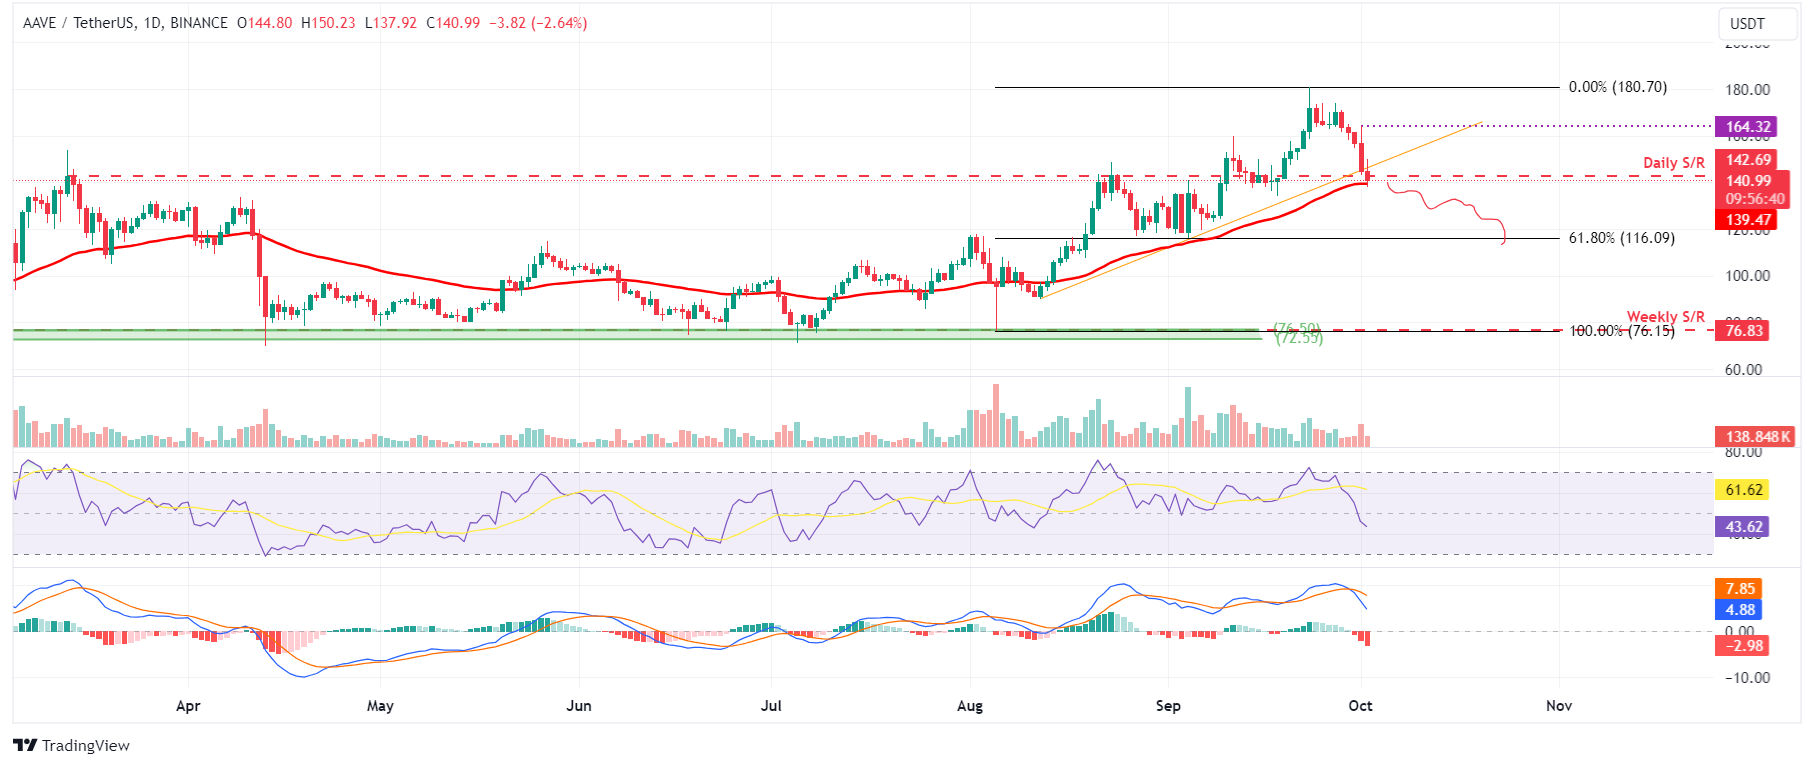
AAVE/USDT daily chart
Aave's Network Realized Profit/Loss (NPL) indicator also aligns with the bearish outlook. This metric computes a daily network-level Return On Investment (ROI) based on the coin's on-chain transaction volume. Simply put, it is used to measure market pain. Strong spikes in a coin's NPL indicate that its holders are, on average, selling their bags at a significant profit. On the other hand, strong dips imply that the coin's holders are, on average, realizing losses, suggesting panic sell-offs and investor capitulation.
In AAVE's case, the NPL indicator spiked from 2.33 million to 7 million from September 22 to September 23 and from 3.58 million to 5.17 million from September 26 to September 27, respectively. These upticks indicate that the holders were, on average booking their profits and increasing the selling pressure.
%20[17.24.35,%2002%20Oct,%202024]-638634773862384733.png)
AAVE Network Realized Profit/Loss chart
Even though on-chain metrics and technical analysis support the bearish outlook, if AAVE makes a daily candlestick close above $164.32, the bearish technical thesis would be invalidated by creating a higher high on the daily chart. This development could see AAVE's price rise by 10% to retest its September 23 high of $180.70.
Information on these pages contains forward-looking statements that involve risks and uncertainties. Markets and instruments profiled on this page are for informational purposes only and should not in any way come across as a recommendation to buy or sell in these assets. You should do your own thorough research before making any investment decisions. FXStreet does not in any way guarantee that this information is free from mistakes, errors, or material misstatements. It also does not guarantee that this information is of a timely nature. Investing in Open Markets involves a great deal of risk, including the loss of all or a portion of your investment, as well as emotional distress. All risks, losses and costs associated with investing, including total loss of principal, are your responsibility. The views and opinions expressed in this article are those of the authors and do not necessarily reflect the official policy or position of FXStreet nor its advertisers. The author will not be held responsible for information that is found at the end of links posted on this page.
If not otherwise explicitly mentioned in the body of the article, at the time of writing, the author has no position in any stock mentioned in this article and no business relationship with any company mentioned. The author has not received compensation for writing this article, other than from FXStreet.
FXStreet and the author do not provide personalized recommendations. The author makes no representations as to the accuracy, completeness, or suitability of this information. FXStreet and the author will not be liable for any errors, omissions or any losses, injuries or damages arising from this information and its display or use. Errors and omissions excepted.
The author and FXStreet are not registered investment advisors and nothing in this article is intended to be investment advice.
Recommended Content
Editors’ Picks

Bitcoin Weekly Forecast: BTC nosedives below $95,000 as spot ETFs record highest daily outflow since launch
Bitcoin price continues to edge down, trading below $95,000 on Friday after declining more than 9% this week. Bitcoin US spot ETFs recorded the highest single-day outflow on Thursday since their launch in January.

Bitcoin crashes to $96,000, altcoins bleed: Top trades for sidelined buyers
Bitcoin (BTC) slipped under the $100,000 milestone and touched the $96,000 level briefly on Friday, a sharp decline that has also hit hard prices of other altcoins and particularly meme coins.

Solana Price Forecast: SOL’s technical outlook and on-chain metrics hint at a double-digit correction
Solana (SOL) price trades in red below $194 on Friday after declining more than 13% this week. The recent downturn has led to $38 million in total liquidations, with over $33 million coming from long positions.

SEC approves Hashdex and Franklin Templeton's combined Bitcoin and Ethereum crypto index ETFs
The SEC approved Hashdex's proposal for a crypto index ETF. The ETF currently features Bitcoin and Ethereum, with possible additions in the future. The agency also approved Franklin Templeton's amendment to its Cboe BZX for a crypto index ETF.

Bitcoin: 2025 outlook brightens on expectations of US pro-crypto policy
Bitcoin (BTC) price has surged more than 140% in 2024, reaching the $100K milestone in early December. The rally was driven by the launch of Bitcoin Spot Exchange Traded Funds (ETFs) in January and the reduced supply following the fourth halving event in April.

Best Forex Brokers with Low Spreads
VERIFIED Low spreads are crucial for reducing trading costs. Explore top Forex brokers offering competitive spreads and high leverage. Compare options for EUR/USD, GBP/USD, USD/JPY, and Gold.