- Shiba Inu is testing a technical line that could spell trouble for the rest of the week.
- SHIB price, once it breaks below the technical line, could be set for a 30% drop.
- Expect a bounce off the descending trend line and a swing back to $0.001000.
Shiba Inu (SHIB) price is under pressure as the token racks up its seventh day of losses – assuming SHIB price does not close above $0.00000859 this evening. To make matters worse, a daily close below a key technical line could bring even more downside risk by increasing the power of bear's hold over price action. Expect this Monday to be crucial for SHIB price action for the rest of the week, with both a 30% drop and a 20% pop potentially on the cards.
SHIB price under siege from the dollar hurricane
Shiba Inu price is in distress after a bloody weekend with traders seeing little silver lining from the previous week’s price action. Given the lack of attractive entry levels in sight, no firm trading plans put forward and the significant inflation headwind not losing strength, it looks like this week will be a repetition of the same scenario of last week. The biggest bogeyman for global markets seems to be ferocious dollar strength, which is grabbing financial markets by the scruff of the neck and keeping investors sidelined for the moment.
SHIB price is at a critical juncture with a fresh can of losses set to be opened if price closes below the red descending trend line tonight. In such a case, another leg lower would be on the cards towards $0.00000600 with the monthly S1 support level and the low of last year nearby. Considering seasonality – with the summer lull just around the corner and the yearly September sell-off also not far – a possible cryptocurrency rally does not look likely, and another 30% drop the more realistic scenario.
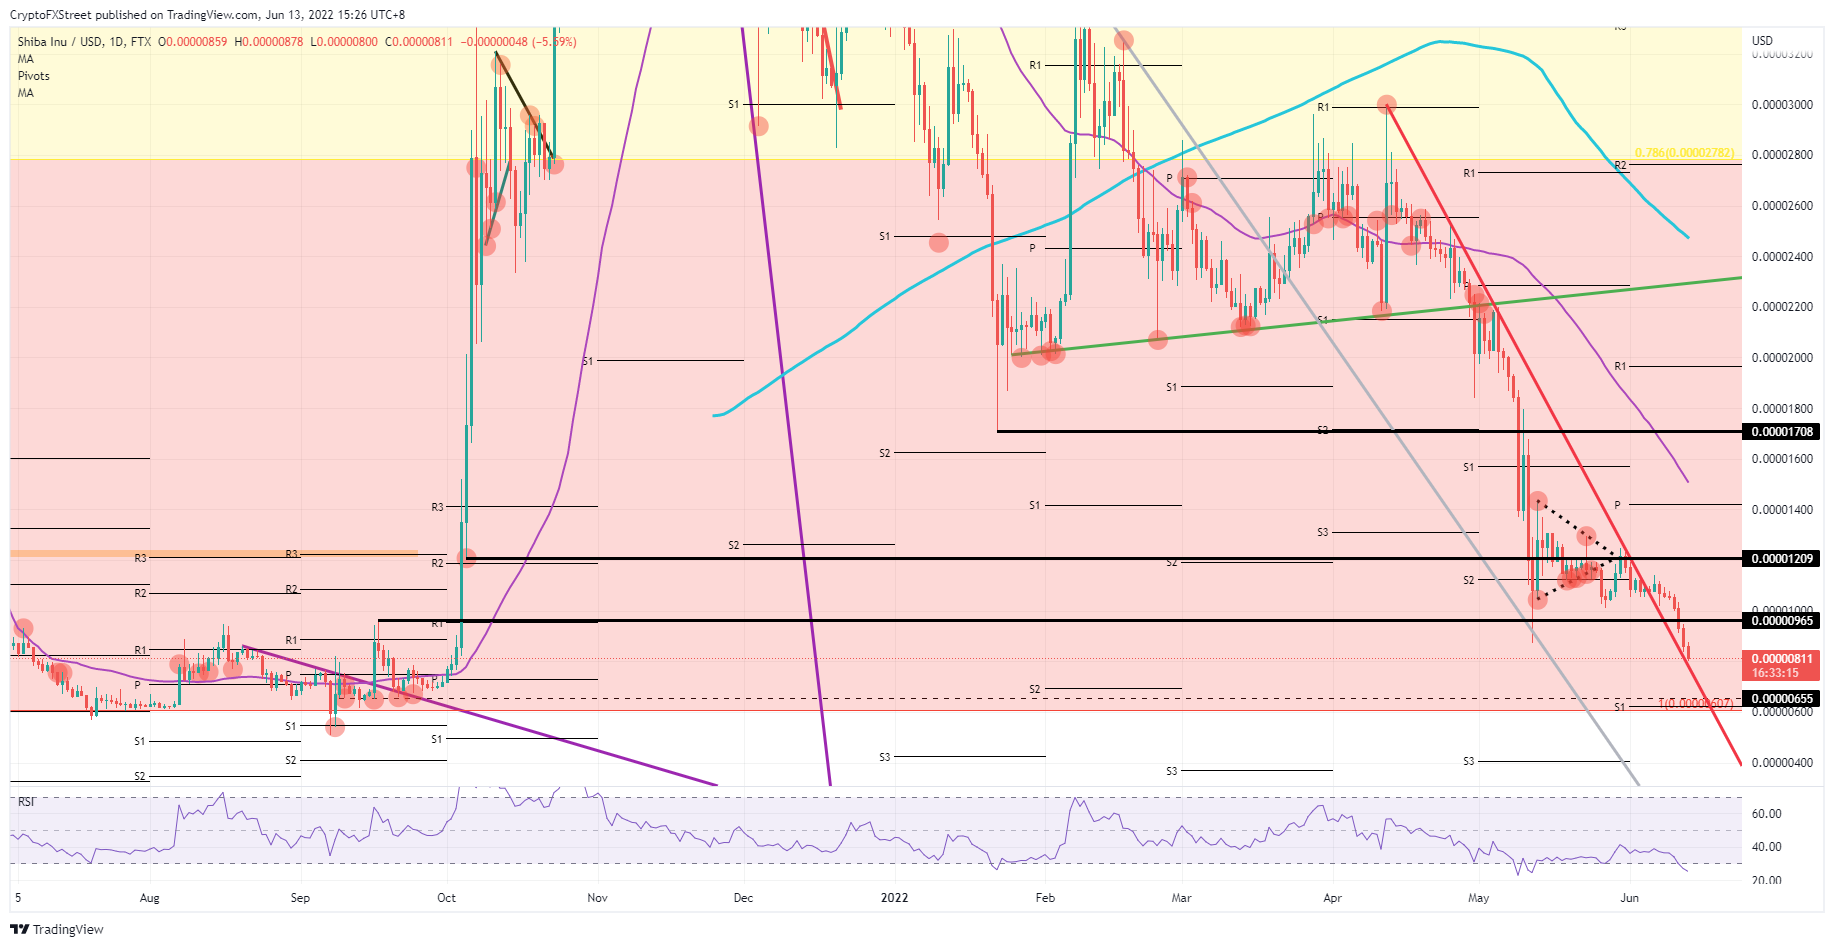
SHIB/USD daily chart
If SHIB can close above the red descending trend line, however, all hope will not be lost, and a retrace back to $0.00001000 may still be possible. From a purely technical perspective, that would fit with a retest and bounce off that same red descending trend line. The Relative Strength Index (RSI) is also supporting such a recovery given it is trading in oversold. This could make up some of the incurred losses from Sunday. Depending on the trading week, a possible unwind of dollar strength could open up some more room to the upside to possibly even $0.00001209.
Information on these pages contains forward-looking statements that involve risks and uncertainties. Markets and instruments profiled on this page are for informational purposes only and should not in any way come across as a recommendation to buy or sell in these assets. You should do your own thorough research before making any investment decisions. FXStreet does not in any way guarantee that this information is free from mistakes, errors, or material misstatements. It also does not guarantee that this information is of a timely nature. Investing in Open Markets involves a great deal of risk, including the loss of all or a portion of your investment, as well as emotional distress. All risks, losses and costs associated with investing, including total loss of principal, are your responsibility. The views and opinions expressed in this article are those of the authors and do not necessarily reflect the official policy or position of FXStreet nor its advertisers. The author will not be held responsible for information that is found at the end of links posted on this page.
If not otherwise explicitly mentioned in the body of the article, at the time of writing, the author has no position in any stock mentioned in this article and no business relationship with any company mentioned. The author has not received compensation for writing this article, other than from FXStreet.
FXStreet and the author do not provide personalized recommendations. The author makes no representations as to the accuracy, completeness, or suitability of this information. FXStreet and the author will not be liable for any errors, omissions or any losses, injuries or damages arising from this information and its display or use. Errors and omissions excepted.
The author and FXStreet are not registered investment advisors and nothing in this article is intended to be investment advice.
Recommended Content
Editors’ Picks

Is Altcoin Season here as Bitcoin reaches a new all-time high?
Bitcoin reaches a new all-time high of $98,384 on Thursday, with altcoins following the suit. Reports highlight that the recent surge in altcoins was fueled by the victory of crypto-friendly candidate Donal Trump in the US presidential election.

Shanghai court confirms legal recognition of crypto ownership
A Shanghai court has confirmed that owning digital assets, including Bitcoin, is legal under Chinese law. Judge Sun Jie of the Shanghai Songjiang People’s Court shared this opinion through the WeChat account of the Shanghai High People’s Court.
BTC hits an all-time high above $97,850, inches away from the $100K mark
Bitcoin hit a new all-time high of $97,852 on Thursday, and the technical outlook suggests a possible continuation of the rally to $100,000. BTC futures have surged past the $100,000 price mark on Deribit, and Lookonchain data shows whales are accumulating.
Shiba Inu holders withdraw 1.67 trillion SHIB tokens from exchange
Shiba Inu trades slightly higher, around $0.000024, on Thursday after declining more than 5% the previous week. SHIB’s on-chain metrics project a bullish outlook as holders accumulate recent dips, and dormant wallets are on the move, all pointing to a recovery in the cards.
Bitcoin: New high of $100K or correction to $78K?
Bitcoin surged to a new all-time high of $93,265 in the first half of the week, followed by a slight decline in the latter half. Reports highlight that Bitcoin’s current level is still not overvalued and could target levels above $100,000 in the coming weeks.

Best Forex Brokers with Low Spreads
VERIFIED Low spreads are crucial for reducing trading costs. Explore top Forex brokers offering competitive spreads and high leverage. Compare options for EUR/USD, GBP/USD, USD/JPY, and Gold.