- MATIC price shows signs of continuing the uptrend if the $1.63 and $1.53 support levels hold.
- Transaction data shows moderate resistance levels present between bulls’ paths to $2 or higher.
- A daily candlestick close below $1.53 will invalidate the bullish thesis for Polygon.
MATIC price looks ready for another leg up as it moves above a crucial resistance barrier. This development with Polygon shows that more gains await for patient holders.
MATIC price awaits higher highs
MATIC price rallied 31% after bouncing off the three-day support level at $1.34 on March 15. The resulting upswing shattered through the equal highs at $1.53 and pushed past the three-day resistance barrier at $1.63.
Although Polygon is facing a minor slowdown, it is necessary for bulls to recuperate for the next leg-up. As long as the MATIC price holds above the $1.53 support level, there is a good chance for the next leg-up to be explosive.
The first hurdle that MATIC price will face is the $1.93 resistance barrier; clearing this blockade will allow bulls to retest the $2 psychological level and the equal highs formed at $2.10. In total, this move would constitute a 30% gain from $1.63.
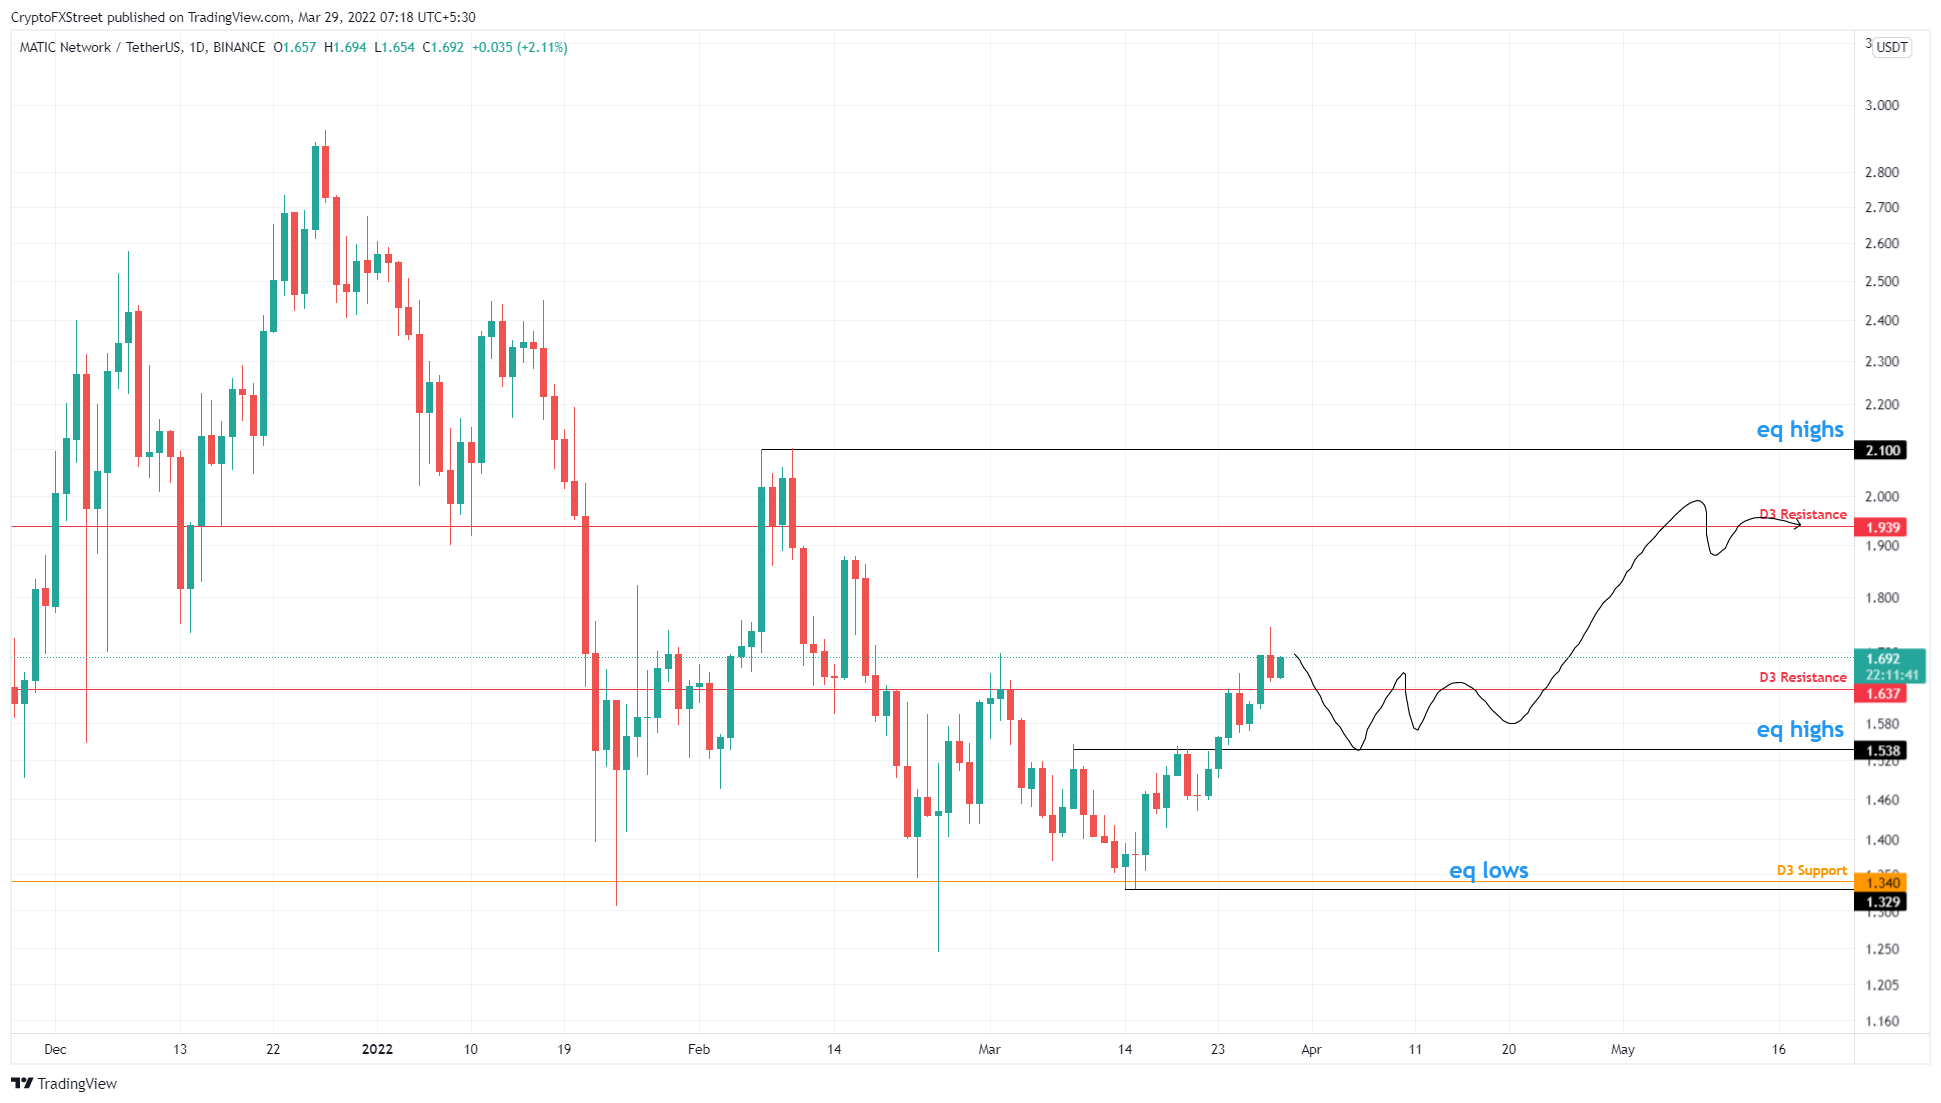
MATIC/USDT 1-day chart
As detailed above, MATIC price needs to hold above the $1.53 support level for an explosive move and the IntoTheBlock’s Global In/Out of the Money (GIOM) model also reveals something similar.
The transaction data shows that roughly 3.13 billion MATIC tokens were purchased between 1.60 and $1.70. Therefore, a decisive move below $1.53 will put these investors “Out of the Money” and potentially trigger a panic sell.
Moreover, the clusters of underwater investors present at $1.72 and $1.83 are relatively weak and will likely be overcome with a quick surge in buying pressure.
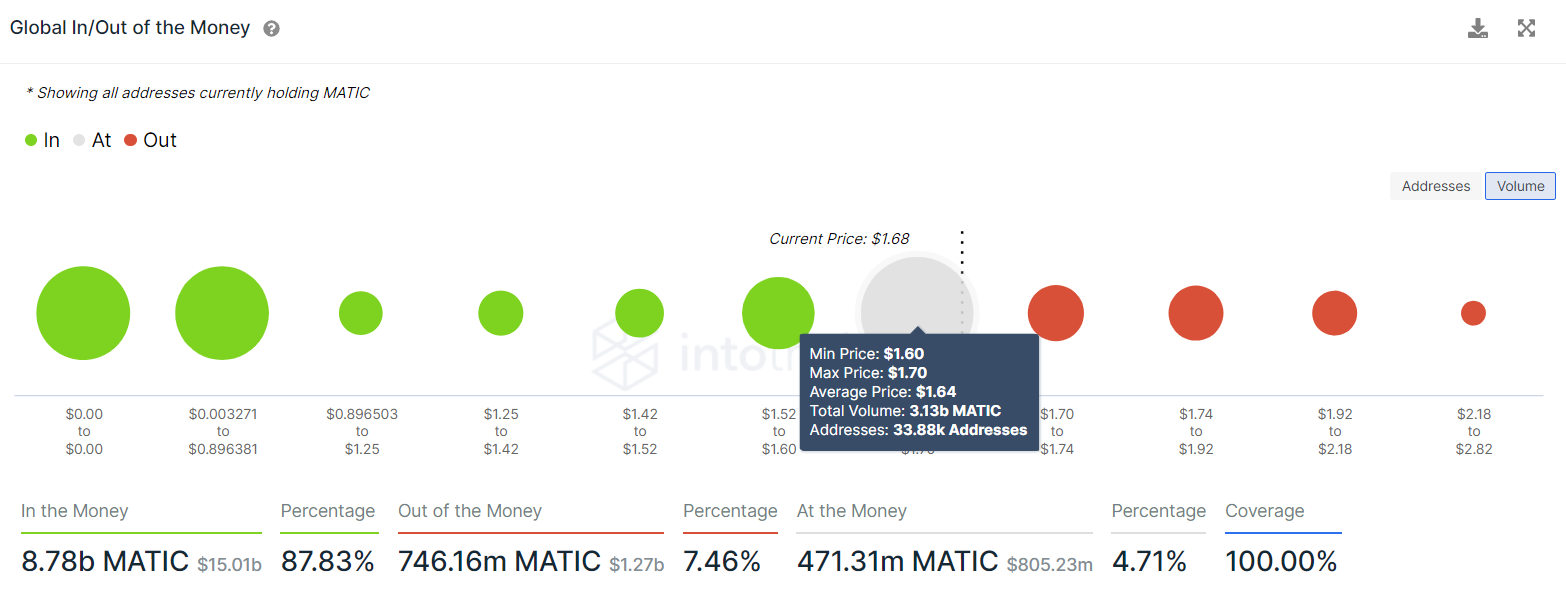
MATIC GIOM
Although the number of new active addresses has progressed from 2,500 to 2,130, which is a relatively small decline over the past month. Hence, the on-chain metrics for MATIC price do not point to a factor that could ruin the run-up to $2 or higher.
The new addresses joining the network show that investors are interested in Polygon at the current price levels. So, the upswing outlook makes sense from both an on-chain and technical perspective.
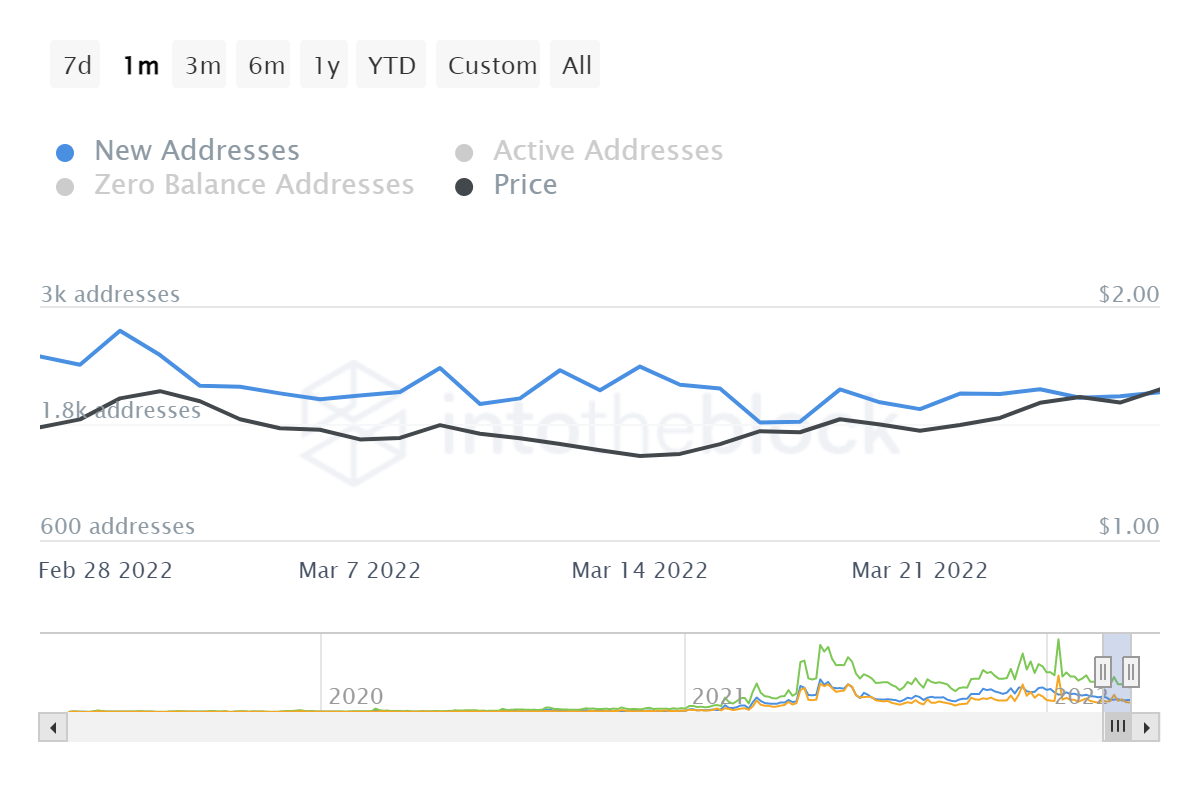
MATIC new addresses
While things are looking up for MATIC price, the optimism is contingent on bulls holding above the $1.53 support level. A decisive daily candlestick close below this level will produce a lower low and invalidate the bullish thesis. In such a case, Polygon could revisit $1.46 before establishing a directional bias.
Information on these pages contains forward-looking statements that involve risks and uncertainties. Markets and instruments profiled on this page are for informational purposes only and should not in any way come across as a recommendation to buy or sell in these assets. You should do your own thorough research before making any investment decisions. FXStreet does not in any way guarantee that this information is free from mistakes, errors, or material misstatements. It also does not guarantee that this information is of a timely nature. Investing in Open Markets involves a great deal of risk, including the loss of all or a portion of your investment, as well as emotional distress. All risks, losses and costs associated with investing, including total loss of principal, are your responsibility. The views and opinions expressed in this article are those of the authors and do not necessarily reflect the official policy or position of FXStreet nor its advertisers. The author will not be held responsible for information that is found at the end of links posted on this page.
If not otherwise explicitly mentioned in the body of the article, at the time of writing, the author has no position in any stock mentioned in this article and no business relationship with any company mentioned. The author has not received compensation for writing this article, other than from FXStreet.
FXStreet and the author do not provide personalized recommendations. The author makes no representations as to the accuracy, completeness, or suitability of this information. FXStreet and the author will not be liable for any errors, omissions or any losses, injuries or damages arising from this information and its display or use. Errors and omissions excepted.
The author and FXStreet are not registered investment advisors and nothing in this article is intended to be investment advice.
Recommended Content
Editors’ Picks
Crypto Today: Bitcoin crumbles under German government transfers, Ethereum and Ripple erase gains
![Crypto Today: Bitcoin crumbles under German government transfers, Ethereum and Ripple erase gains](https://editorial.fxstreet.com/images/Markets/Currencies/Digital%20Currencies/Bitcoin/bitcoin-64028817_XtraSmall.jpg)
Bitcoin trades below $57,100 on Thursday as German government transfers continue, $76 million BTC moved to exchanges. Ethereum trades near $3,100 ahead of the upcoming SEC decision on the Spot Ethereum ETF.
Ripple traders take over $75 million in losses in July, XRP drops below key support
![Ripple traders take over $75 million in losses in July, XRP drops below key support](https://editorial.fxstreet.com/images/Markets/Currencies/Cryptocurrencies/Coins/Ripple/ripple_XtraSmall.jpg)
Ripple (XRP) price is under fresh selling pressure and tests key support at the June 7 low of $0.4508 on Thursday as whales are likely capitulating, according to on-chain data.
Bitcoin price declines as supply on exchanges rises
![Bitcoin price declines as supply on exchanges rises](https://editorial.fxstreet.com/images/Markets/Currencies/Digital%20Currencies/Bitcoin/bitcoin_closer_XtraSmall.jpg)
Bitcoin faced rejection at the daily resistance level of $63,956 on Monday, resulting in a 4.2% decline over the next two days. BTC’s price extends its downward move and falls below $58,000 on Thursday, adding more than 4% losses in the day.
Worldcoin is poised for 17% rally as as technical indicators signal bullish momentum
![Worldcoin is poised for 17% rally as as technical indicators signal bullish momentum](https://editorial.fxstreet.com/images/Markets/Currencies/Cryptocurrencies/Worldcoin/Worldcoin_XtraSmall.png)
Worldcoin price finds support and bounces 9% from the weekly support level around $2.183. Technical analysis shows that WLD has formed a bullish divergence on a momentum indicator.
Bitcoin: BTC price correction could end in July, according to seasonal data
![Bitcoin: BTC price correction could end in July, according to seasonal data](https://editorial.fxstreet.com/images/Markets/Currencies/Digital%20Currencies/Bitcoin/bitcoin_5_XtraSmall.jpg)
Bitcoin (BTC) price appears poised for a decline this week, influenced by slight outflows in US spot ETFs, selling activity among BTC miners, and a combined transfer of 4,690.28 BTC to centralized exchanges by the US and German governments.