• Tezos price has been down 20% since September.
  • The downtrend has been turbulent, suggesting a bullish recoil effect could occur.
  • A breach above $1.45 could induce a 27% rally.

Tezos price shows a potential swing trade setup. Key levels have been defined,=

Tezos price has potential  

Tezos (XTZ) price has been underwater throughout the fall as the bulls have endured a persistent 20% decline. However, when observing the technicals, subtle cues suggest that the bulls are building up steam for a significant countertrend punch.

XTZ price currently auctions at $1.39. The declining trend has created a wedge-like pattern many Elliot Wave practitioners call an ending diagonal. Towards the bottom of the pattern, large amounts of volume have poured into the market. On October 25, the bulls successfully herded the 8-day exponential and 21-day simple moving averages. The Relative Strength Index has also crossed back into supportive terrain while creating several bullish divergences.

tm/xtz/10.25.22

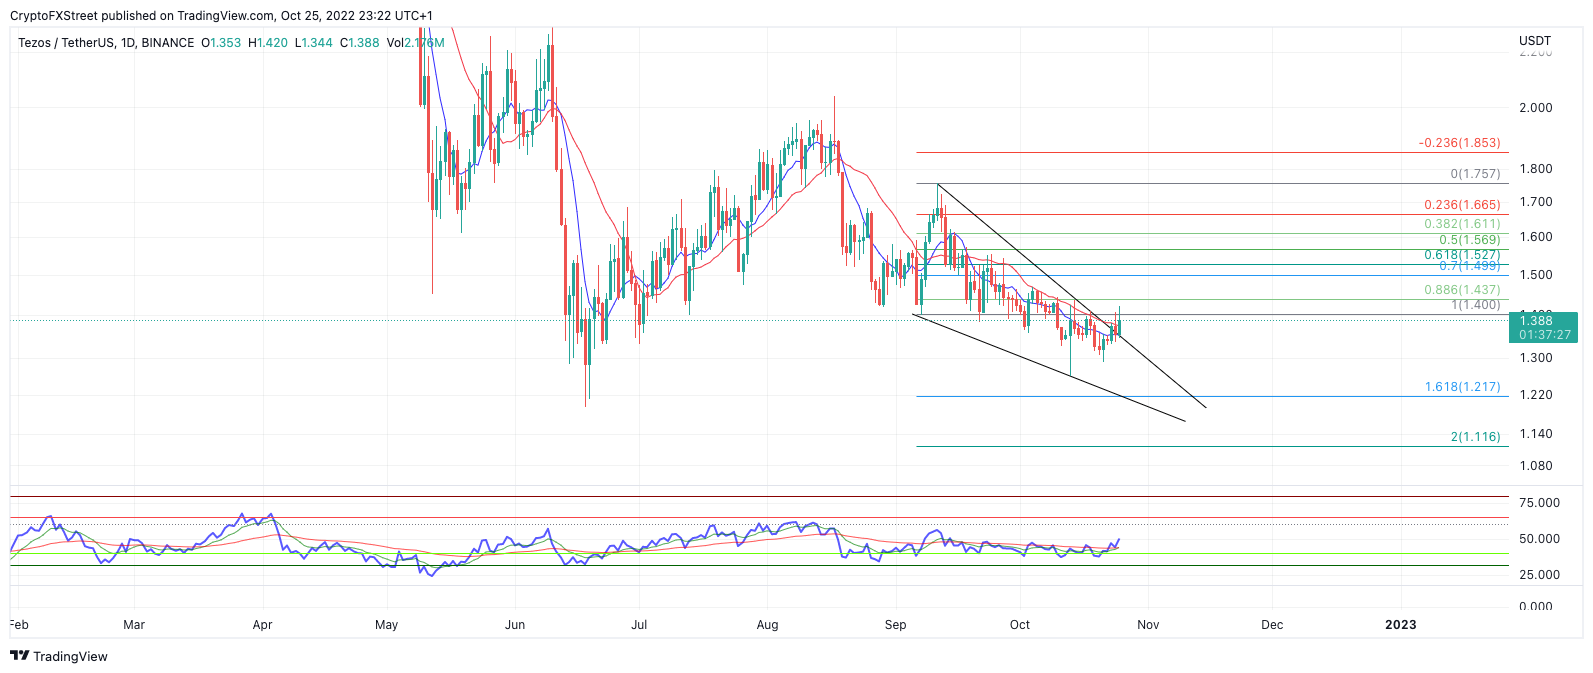
If the technicals are correct, Tezos price could be setting up for a skyrocketing 27% rally toward the September highs at $1.76. A breach above the $1.45 swing high will be the final confirmation and an ideal entry point for sidelined bulls.

If the confirmation signal occurs, the invalidation of the bullish thesis will be a breach below the October 13 swing low at $1.25.  On the contrary, A breach of the 1.25 low could induce a seller's frenzy targeting liquidity levels near $1.00 resulting in a 25% decline.

In the following video, our analysts deep dive into the price action of Tezos, analyzing key levels of interest in the market. -FXStreet Team


Information on these pages contains forward-looking statements that involve risks and uncertainties. Markets and instruments profiled on this page are for informational purposes only and should not in any way come across as a recommendation to buy or sell in these assets. You should do your own thorough research before making any investment decisions. FXStreet does not in any way guarantee that this information is free from mistakes, errors, or material misstatements. It also does not guarantee that this information is of a timely nature. Investing in Open Markets involves a great deal of risk, including the loss of all or a portion of your investment, as well as emotional distress. All risks, losses and costs associated with investing, including total loss of principal, are your responsibility. The views and opinions expressed in this article are those of the authors and do not necessarily reflect the official policy or position of FXStreet nor its advertisers. The author will not be held responsible for information that is found at the end of links posted on this page.

If not otherwise explicitly mentioned in the body of the article, at the time of writing, the author has no position in any stock mentioned in this article and no business relationship with any company mentioned. The author has not received compensation for writing this article, other than from FXStreet.

FXStreet and the author do not provide personalized recommendations. The author makes no representations as to the accuracy, completeness, or suitability of this information. FXStreet and the author will not be liable for any errors, omissions or any losses, injuries or damages arising from this information and its display or use. Errors and omissions excepted.

The author and FXStreet are not registered investment advisors and nothing in this article is intended to be investment advice.

Join Telegram

Recommended content


Recommended Content

Editors’ Picks

Ripple on-chain metrics show bullish signs amidst legal struggle with SEC, XRP eyes recovery

Ripple on-chain metrics show bullish signs amidst legal struggle with SEC, XRP eyes recovery

Ripple made a comeback above $0.48 on Tuesday and hovers above that level in Wednesday’s European session. Ripple on-chain metrics such as transaction volume and Network Realized Profit/Loss have turned bullish, supporting a recovery in the altcoin. 

More Ripple News

Bitcoin price falls amidst German government transfers, miners activity

Bitcoin price falls amidst German government transfers, miners activity

Bitcoin (BTC) extends correction on Wednesday and hovers around $61,000 after finding resistance near the $64,000 level on Monday. Recent on-chain data indicates heightened selling activity from Bitcoin miners early in the week. 

More Bitcoin News

Crypto Today: Bitcoin erases gains from end of June, Ethereum declines while Ripple holds

Crypto Today: Bitcoin erases gains from end of June, Ethereum declines while Ripple holds

Bitcoin wipes out gains from the last week of June and falls below $60,000 on Wednesday. Ethereum and top altcoins ranked by market capitalization erased gains as the inflation outlook worsened. Ripple holds on to recent gains and hovers above $0.48 on Wednesday. 

More Cryptocurrencies News

Three reasons why altcoins could shake off losses this week

Three reasons why altcoins could shake off losses this week

On-chain data from Santiment shows that altcoins are currently in the opportunity zone, or generating buy signals. The top three altcoins in the buy zone are Basic Attention Token (BAT), Chromia (CHR), and Highstreet (HIGH), per Santiment. 

More Altcoins News

Bitcoin: BTC price correction could end in July, according to seasonal data

Bitcoin: BTC price correction could end in July, according to seasonal data

Bitcoin (BTC) price appears poised for a decline this week, influenced by slight outflows in US spot ETFs, selling activity among BTC miners, and a combined transfer of 4,690.28 BTC to centralized exchanges by the US and German governments.

Read full analysis

BTC

ETH

XRP